Written by Robin Lundh, Research Manager and Anna Shepperson, Research Associate.
Immigration—long central to the American experience—has dominated news coverage in recent years. Between 2016 and 2021 alone, record numbers of migrants arrived at the southern border; the Trump administration imposed travel bans on several Middle Eastern countries; immigrants played vital roles as essential workers in the COVID-19 pandemic; and the Biden administration called on Congress to reform decades-old immigration laws, to name just a few issues that have taken central stage.
The American Immigration Council’s Map the Impact, an annual analysis of U.S. immigration data, reveals notable shifts during this five-year period in the demographics of foreign-born residents and how they continue to make significant contributions to the American economy.
Population Shifts
Between 2016 and 2021, the immigrant population in the United States grew by 3.7%, or 1.6 million people. This accounted for 18.3% of the total population gain in the country.
At the same time, some immigrant sub-groups shrank. The number of refugees living in the United States decreased by 6.4%. The number of undocumented immigrants fell by 9.2%, while DACA-eligible residents dropped by 27.3%.
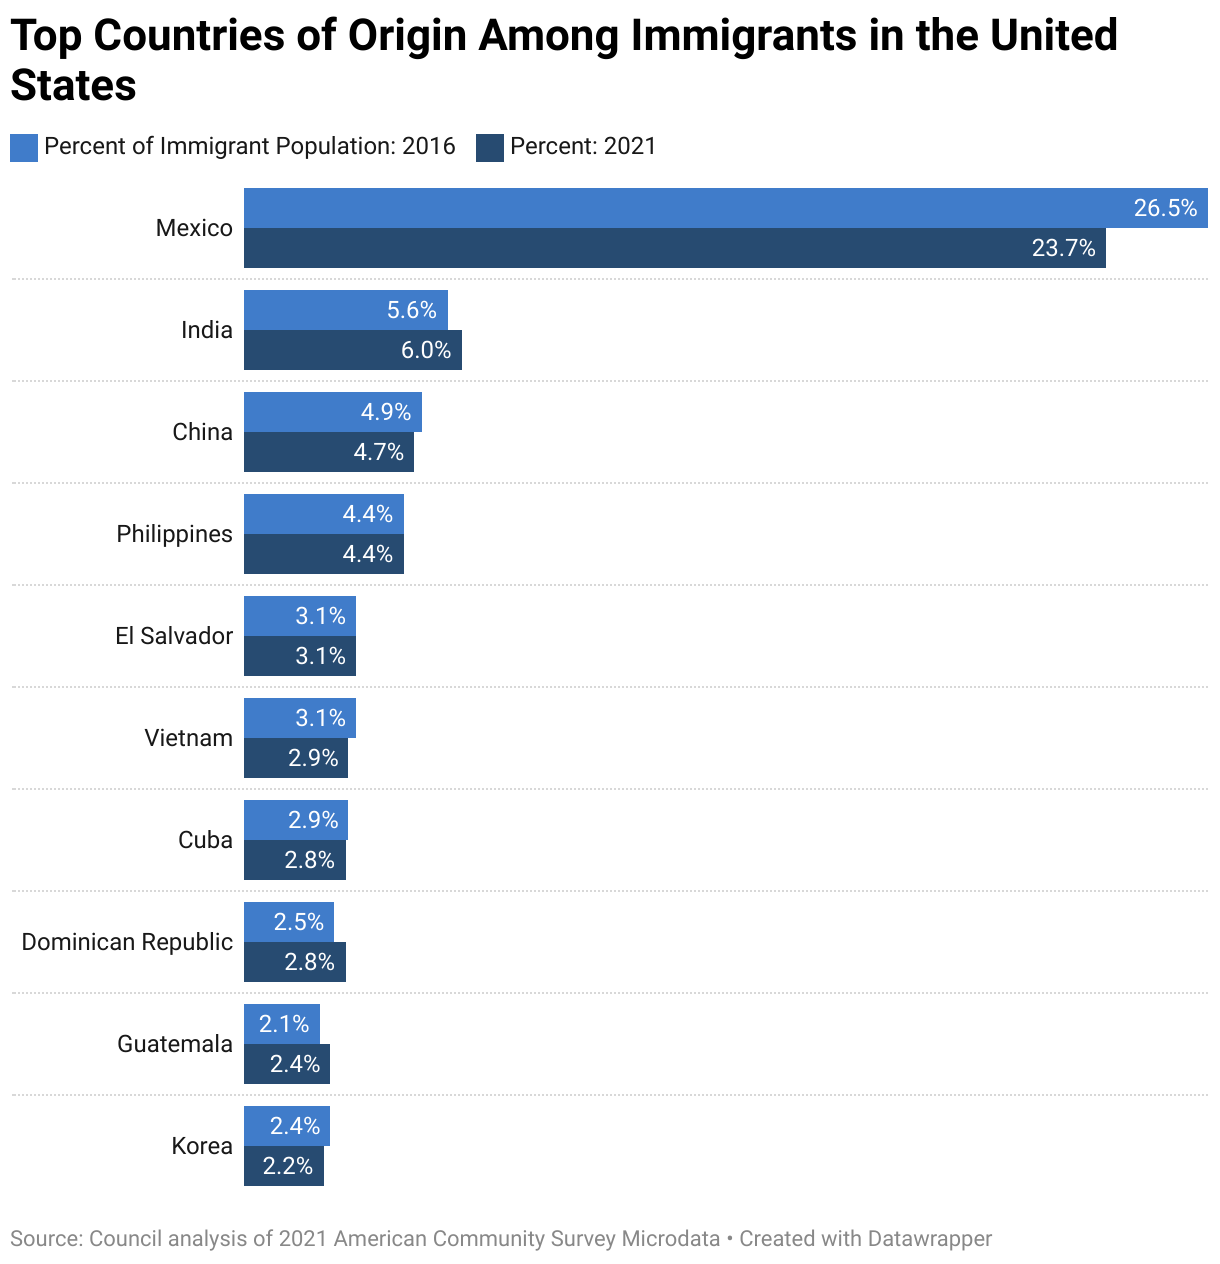
Where immigrants are coming from is also shifting. The top countries of origin among immigrant residents remained constant, with Mexico, India, China, Philippines, and El Salvador being the most common birthplaces. But while those who were born in Mexico still occupied the largest share of immigrants in America, they nonetheless experienced the largest population decline.
In 2016, people from Mexico comprised 26.5% of the immigrant population in the United States. By 2021, their number had dropped by 856,000 people and they comprised just 23.7% of the immigrant population.
Immigrants from Venezuela, meanwhile, saw a significant increase, as escalating political and economic turmoil has driven people to flee their home country. In the United States, the number of immigrants from Venezuela rose by 260,000 people—a 92.5% increase from five years earlier.
The number of immigrants from Gambia also nearly doubled. The addition of 11,300 Gambians represented a 94.6% increase. Meanwhile, immigrants from India had the largest total increase in population—279,000 people—during this five-year period.
Geographic Distribution
While California remained home to the most immigrants—with about 10.5 million immigrants, or 26.7% of the state’s total population—Texas saw the largest increase, with an additional 391,000 immigrants living in the state in 2021.
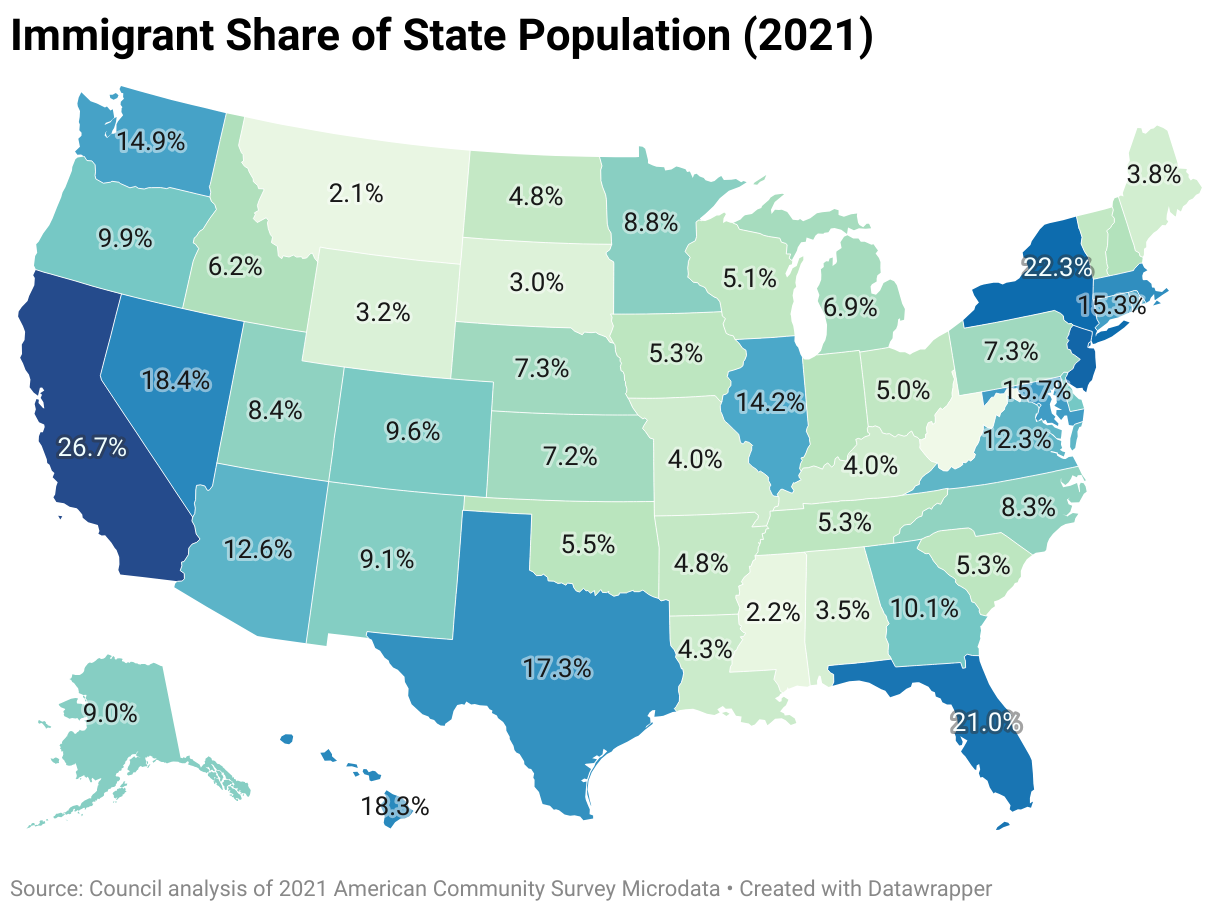
Earlier reports have already noted changing patterns of migration to rural areas and non-traditional immigrant states, and the recent data reflects that shift. For example, North Dakota experienced the fastest growth in its immigrant population, of 54.1%. The addition of almost 13,000 immigrant residents meant that immigrants comprised 4.8% of the state’s population, up from 3.2% in 2016.
Immigrants in the Labor Force
Immigrants continue to play an outsized role in the labor force, not only filling roles vacated by baby boomers but also plugging growing gaps in jobs vital to the wellbeing of all Americans, such as healthcare.
Because immigrants are more likely to be of working age than U.S.-born residents, they continue to make up a larger share of the workforce. With the baby boom generation aging out of the workforce, this younger immigrant population will become even more critical.
In 2021, 78.0% of foreign-born residents were of working age, compared with just 61.4% of U.S.-born residents. As a result, 17.1% of people active in the labor force were foreign-born, even though foreign-born people comprised just 13.6% of the overall population.
The essential role of immigrants was particularly pronounced during the COVID-19 pandemic, which saw an unprecedented need for healthcare workers, many of whom are immigrants. Immigrants were overrepresented as nurses—making up 15.2% of all nurses nationally. In five states, more than one out of every four nurses were immigrants: California (36.1%); Nevada (32.2%); New Jersey (29.7%); Florida (27.0%); and New York (26.5%).
A disproportionate number of health aides were immigrants as well, and their share is rising. From 2016 to 2021, the share of health aides that were immigrants increased from 23.3% to 25.8%. In New York state, more than half of all health aides (54.9%) were immigrants in 2021.
The occupations with the highest share of foreign-born workers in 2021 were: manicurists and pedicurists (74.6%); graders and sorters of agricultural products (57.5%); plasterers and stucco masons (56.0%); taxi drivers (54.4%); and drywall and ceiling tile installers (53.2%).
Immigrants also fill roles that are vital to U.S. job creation and growth. While a severe shortage of workers specialized in STEM (science, technology, engineering, and math) fields threatens U.S. economic growth and international competitiveness, immigrants help meet the demand for skilled labor. In 2021, 22.8% of all STEM workers in the United States were foreign-born. This equated to 2.7 million immigrant STEM workers, a 29.7% increase from 2016.
Entrepreneurship
Immigrants have long had a strong entrepreneurial spirit, and their role as business founders appears to be growing. In 2021, 22.2% of all entrepreneurs in the United States were foreign-born, an increase from 21.4% in 2016. This means that an additional 358,000 foreign-born entrepreneurs were added to the country over those five years. In total, immigrant business owners generated $95.6 trillion in income, or $15 billion more than in 2016 after taking inflation into account.
In some states, the share of entrepreneurs who were immigrants in 2021 was particularly high, such as California (38.9%), Florida (36.2%), New Jersey (35.0%), and Texas (30.8%).
Tax Contributions and Spending Power
Immigrants also continue to play a vital role in shaping our economy as taxpayers and consumers.
The total income of immigrant households increased by 24.1%, from $1.56 trillion (adjusted to the 2021 dollar) to $1.94 trillion. Of this, immigrants paid more than $346.3 billion in federal taxes in 2021 ($49.4 billion more than in 2016) and more than $178.4 billion in combined state and local taxes, money used to help pay for healthcare, police, roads, schools, and other public services vital to all Americans. Similarly, the income of households led by undocumented immigrants increased by 13.2%, resulting in $18.9 billion in federal taxes paid in 2021.
Naturalization and Voting
The ability of immigrants to impact the outcome of elections continues to grow. While 47.6% of immigrants were naturalized citizens in 2016, 52.5% were in 2021. At the same time, as the population aged into adulthood, the number of immigrants eligible to vote increased by almost 3 million people.
The news cycle tends to link immigration issues with crises: economic and political upheaval abroad; border crossings; travel bans. But analyzing the data gives us another picture: one of the continuing and evolving role immigrants play in our nation’s economic and civic wellbeing. As the latest Map the Impact shows, the immigrant population in the United States is growing and its migration patterns are shifting—changes all seen throughout the history of immigration in this country. Map the Impact also provides details on other constants: the ways in which immigrants fill vital roles in the labor market, open businesses, and contribute billions of dollars in taxes and consumer spending in our communities.
As the United States shifts in its own ways—a shrinking workforce, an aging population that strains the healthcare system, schools that struggle to fulfill labor-market demands—immigrants continue to fill the gaps and drive the innovation needed to make America succeed.