
Data from the 2020 U.S. Census Bureau show that there are approximately 20.7 million Asian and Pacific Islanders in the United States—comprising 6.2 % of the U.S. population—that make up the fastest growing minority group in the United States.
In the last decade, the U.S. Asian population grew by 35.5 %, reaching almost 20 million people in 2020. For their part, Pacific Islanders also saw robust growth, going from 540,000 to almost 690,000, an increase of 28 %, from 2010 to 2020.
The 20.7 million strong AAPI community is also one of the most diverse in the country not only in terms of ancestry but also in terms of socioeconomic well-being. This reflects the disparate histories that each group of Asians and Pacific Islanders has faced in the United States.
In ancestry, the data show that Chinese Americans were the largest AAPI group in the United States, numbering more than 4.24 million, followed by Indian Americans (4.21 million), and Filipino Americans (2.9 million). Among AAPI immigrants, India was the most common country of birth, followed by Mainland China, the Philippines, and Vietnam.
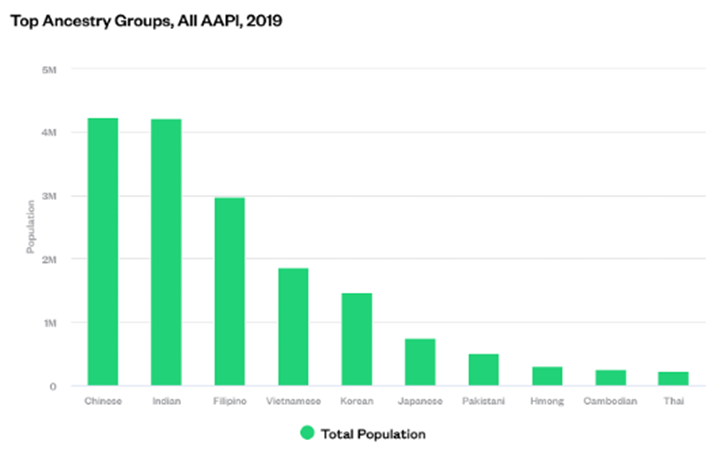
Source: AIC analysis of 2019 American Community Survey Microdata
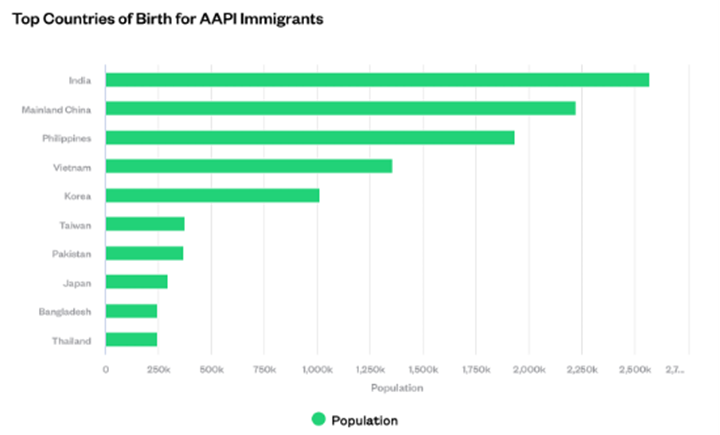
Source: AIC analysis of 2019 American Community Survey Microdata
While more prominent than ever in American public life, the rise in anti-Asian bias attacks and rhetoric have brought new attention to numerous stereotypes that have long plagued Asian and Pacific Islander Americans.
One of the most problematic, the perpetual foreigner stereotype, depicts Asian American and Pacific Islanders as outsiders and aliens regardless of where they were born or how long they have lived in the United States. This all, of course, runs counter to reality and data. Asians and Pacific Islanders have a long history in what is now the United States, dating back to the 18th century. After decades of significant immigration from Asia following the 1965 removal of discriminatory country quotas, the AAPI population is increasingly U.S.-born, with the U.S.-born AAPI population now growing faster than the AAPI immigrant population.
The AAPI community is as diverse economically as it is in terms of ancestry. This runs counter to another stubborn stereotype, Asians as a ‘model minority.’ This stereotype holds that all Asians and Pacific Islanders are highly educated and economically successful. This has the effect of holding up selected AAPI groups while hiding lingering challenges and struggles of many other vulnerable Asian and Pacific Islander communities.
Looking at median incomes in 2019 among the 15 largest AAPI ancestry groups, we find a wide range of median incomes. Indian Americans had the highest median income at $79.903, followed by Taiwanese Americans ($72,832), Japanese Americans ($66,821), and Filipino Americans ($62,931), in comparison to a median income of $51,038 for non-Hispanic Whites. Meanwhile, Bangladeshi Americans ($40,374), Hmong Americans ($41,378), and Nepalese Americans ($45,033) fell at the lower end of the income distribution. This represents a significant income gap within the AAPI community.
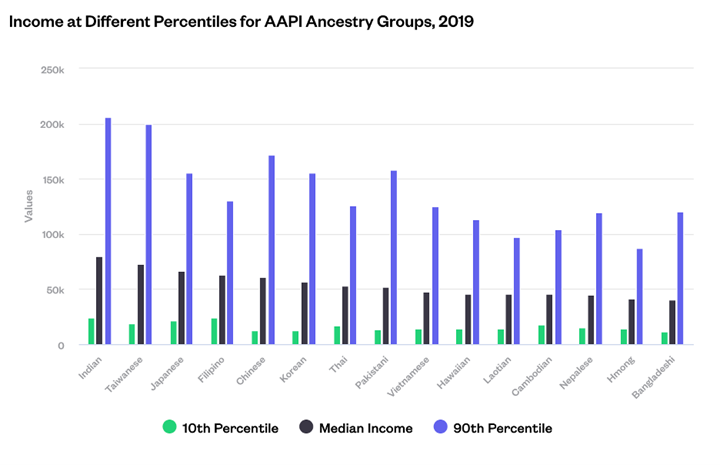
Source: AIC analysis of 2019 American Community Survey Microdata
While the AAPI community contributes significantly to the economy as a whole—for example, AAPI households earned more than $783.7 billion in income in 2019—a closer look reveals that the AAPI community, and AAPI immigrants in particular, suffer from high levels of income inequality. AAPI workers in the top 10 % of the income distribution earn almost 10 times what the bottom 10 % of AAPI workers do. Among white workers, this ratio is much lower at 7.8, and even lower for Hispanic Americans at 7.5.
Further contradictions exist as well. On average, more than half, or 54.7 %, of Asian and Pacific Islander Americans have a college degree, compared to barely 1 out of 3 people in the United States overall. While Asian and Pacific Islander Americans are more likely to have a college degree, a higher share of them lack a high school diploma compared to the U.S. overall. This means that Asian and Pacific Islanders are disproportionately distributed at the opposite ends of the educational spectrum, while AAPI workers rank among some of the highest earners in the United States, many others, especially those without a college degree, have less stable and far more modest incomes.
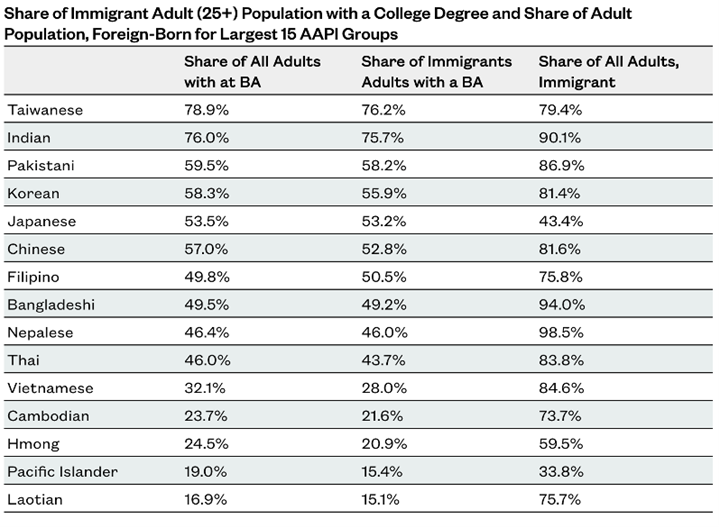
Source: AIC analysis of 2019 American Community Survey Microdata
The relationship between education and earnings is also not straight-forward. While almost half of all Bangladeshi American hold a college degree, as a community they suffer from some of the highest poverty rates in the country, with 19.1 % living under the poverty line.
These data points show some of the tremendous advancement that Asians and Pacific Islanders have made in the United States despite a difficult history. This history includes the Chinese Exclusion Act, the internment of Japanese Americans, wars in Indochina, violence against Sikh Americans post-9/11, and most recently, increases in anti-AAPI sentiment during the Covid-19 pandemic. While providing evidence of being able to overcome these challenges, these data points also expose areas where serious challenges remain for many AAPI communities, especially AAPI immigrants and refugees when it comes to questions of poverty, education, and legal status in the United States. With about one-fifth of the U.S. population growth now attributable to Asian and Pacific Islanders, the future of America is now inexorably tied to the well-being and success of the AAPI community.