
It has long been the case that immigrants have a right to counsel in immigration court, but that expense has generally been borne by the noncitizen. Because deportation is classified as a civil rather than a criminal sanction, immigrants facing removal are not afforded the constitutional protections under the Sixth Amendment that are provided to criminal defendants. Whereas in the criminal justice system, all defendants facing even one day in jail are provided an attorney if they cannot afford one, immigrants facing deportation generally do not have that opportunity. Detained immigrants, particularly those held in remote locations, face the additional obstacle of accessing counsel from behind bars. Yet, in every immigration case, the government is represented by a trained attorney who can argue for deportation, regardless of whether the immigrant is represented.
The lack of appointed counsel may have a profound impact on immigrants’ ability to receive a fair hearing. Past research has highlighted the importance of counsel for asylum seekers, and regional studies have highlighted the important role attorneys play for immigrants navigating immigration courts in New York and San Francisco. Yet, up to now, the debate about access to counsel has proceeded with little reliable national information on how many immigrants facing deportation obtain attorneys, the barriers to accessing representation, and how such representation impacts the outcomes of their cases.
This report presents the results of the first national study of access to counsel in U.S. immigration courts. Drawing on data from over 1.2 million deportation cases decided between 2007 and 2012, the report provides much-needed information about the scope and impact of attorney representation in U.S. immigration courts.
The main findings of this study include:
Access to counsel is scarce and unevenly distributed across the United States
- Nationally, only 37 percent of all immigrants secured legal representation in their removal cases.
- Immigrants in detention were the least likely to obtain representation. Only 14 percent of detained immigrants acquired legal counsel, compared with two-thirds of nondetained immigrants.
- Representation rates varied widely by court jurisdiction.
- New York City’s representation rate for nondetained cases (87 percent) was a full 40 percent higher than that of Atlanta (47 percent).
- Immigrants with court hearings in small cities were more than four times less likely to obtain counsel than those with hearings in large cities (11 percent in small cities versus 47 percent in large cities).
- Immigrants of different nationalities had very different representation and detention rates.
- Mexican immigrants had the highest detention rate (78 percent) and the lowest representation rate (21 percent) of nationalities examined. In contrast, Chinese immigrants had the lowest detention rate (4 percent) and highest representation rate (92 percent).
Immigrants with attorneys fare better at every stage of the court process
- Represented immigrants in detention who had a custody hearing were four times more likely to be released from detention (44 percent with counsel versus 11 percent without).
- Represented immigrants were much more likely to apply for relief from deportation.
- Detained immigrants with counsel were nearly 11 times more likely to seek relief such as asylum than those without representation (32 percent with counsel versus 3 percent without).
- Immigrants who were never detained were five times more likely to seek relief if they had an attorney (78 percent with counsel versus 15 percent without).
- Represented immigrants were more likely to obtain the immigration relief they sought.
- Among detained immigrants, those with representation were twice as likely as unrepresented immigrants to obtain immigration relief if they sought it (49 percent with counsel versus 23 percent without).
- Represented immigrants who were never detained were nearly five times more likely than their unrepresented counterparts to obtain relief if they sought it (63 percent with counsel versus 13 percent without).
About the Data
This report analyzes the government’s own court records in immigration cases. Using the Freedom of Information Act (FOIA), these court records were obtained from the Executive Office for Immigration Review (EOIR), the division of the Department of Justice that conducts immigration court proceedings. The complete EOIR administrative database included 6,165,128 individual immigration proceedings spanning fiscal years 1951 to 2013. These data were reduced to an analytical sample of 1,206,633 individual removal cases in which immigration judges reached a decision on the merits between fiscal years 2007 and 2012. The analysis set out in this report appears in expanded form, together with a detailed methodological appendix, in Ingrid Eagly and Steven Shafer, “A National Study of Access to Counsel in Immigration Court,” University of Pennsylvania Law Review 164, no. 1 (December 2015): 1–91.
Nationally, only 37 percent of all immigrants, and a mere 14 percent of detained immigrants, secured legal representation. Rates of legal representation varied by a number of factors including geographic location of the court and the immigrant’s nationality. Immigrants with court hearings in large cities were more likely to be represented than those with hearings in small cities. Immigrants from Mexico were the least likely of any nationality group to be represented by counsel in their removal proceedings.
Defining Terms: Detained, Released, and Never Detained Immigrants
This report uses a number of different terms to refer to the custody status of immigrants in removal proceedings. More than half of immigrants facing removal in immigration court during the six-year period covered in this report (2007–2012) spent their entire case in government custody—almost 56 percent of immigrants were “detained” in prisons, jails, and detention centers across the country as they awaited the decision of an immigration judge. Some immigrants that started out in detention, however, were released from custody before their cases were decided. These “released” immigrants made up 10 percent of the immigrants in the study. Finally, some immigrants were never placed in government custody during the pendency of their case. These “never detained” immigrants accounted for 34 percent of immigrants in this study. Throughout this report the term “nondetained” is used to refer to both released and never detained immigrants as a group.
Overall representation rates are shockingly low, especially for detained immigrants
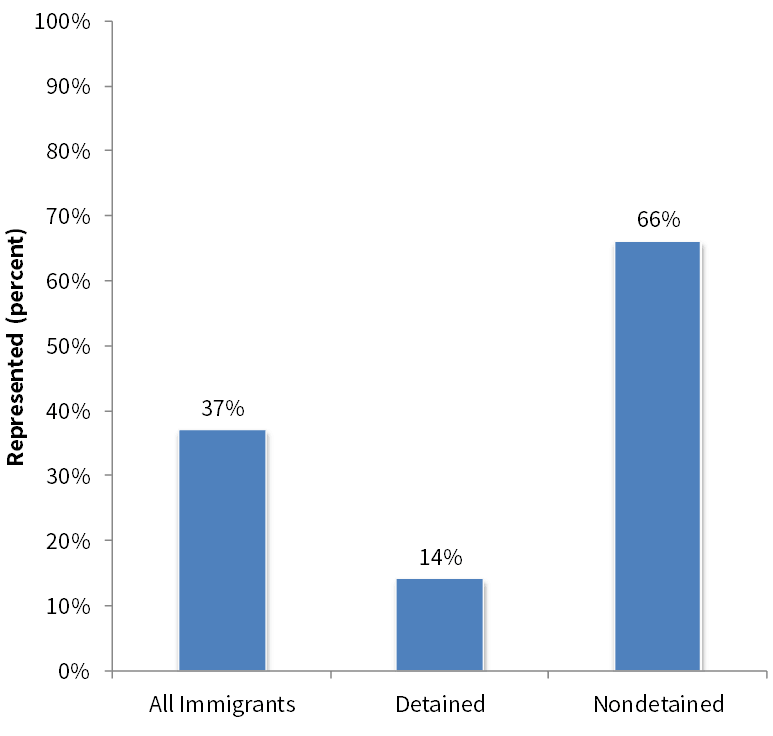
During the six-year period from 2007 to 2012, little more than one-third of immigrants were represented by counsel (37 percent). Detained immigrants—held in prisons, jails, and detention centers across the country—were the least likely of all immigrants to be represented. As Figure 1 shows, across the six-year period studied, only 14 percent of detained immigrants secured an attorney, almost five times less than nondetained immigrants (66 percent).
Figure 1: Representation Rates for Immigrants in Removal Proceedings, 2007–2012
Detained Immigrants Much Less Likely to Have Legal Counsel
Source: Authors’ analysis of Executive Office for Immigration Review data, 2007–2012.
There are many reasons why it may be harder for immigrants in detention to obtain representation. By definition, they are confined in prisons, jails, and federal detention centers that do not allow them to travel to an attorney’s office. Instead, they must rely on telephones in their facilities to call attorneys, and sometimes phones may not be available. Attorneys must adhere to strict visitation rules, making it difficult for lawyers to communicate with their clients. Unlike the criminal justice system, which requires defendants to stand trial in the same district in which the alleged offense occurred, in the immigration system noncitizens can be transferred to detention centers located a great distance from where they reside or were apprehended. This means that they are far from their families, lawyers, and the evidence they need to support their cases. Furthermore, many detention facilities are located in remote areas.
Ability to pay is another obstacle to obtaining representation. In order to have representation, immigrants generally must be able to pay for their services. Immigrants who are detained are unable to work to pay for counsel. Although some pro bono or reduced fee services are available, they are not nearly sufficient to meet demand. Analysis of the national representation data reveals that only a very small proportion of immigrants ever received some form of pro bono representation.
These barriers to finding counsel are especially troubling considering that immigration enforcement has become increasingly reliant on detention. Today, federal funding allows for approximately 34,000 noncitizens to be held in federal detention centers, jails, and prisons each day. This heavy reliance on detention to facilitate deportation only exacerbates the serious problems noncitizens have obtaining legal counsel.
Representation rates vary dramatically across different court jurisdictions
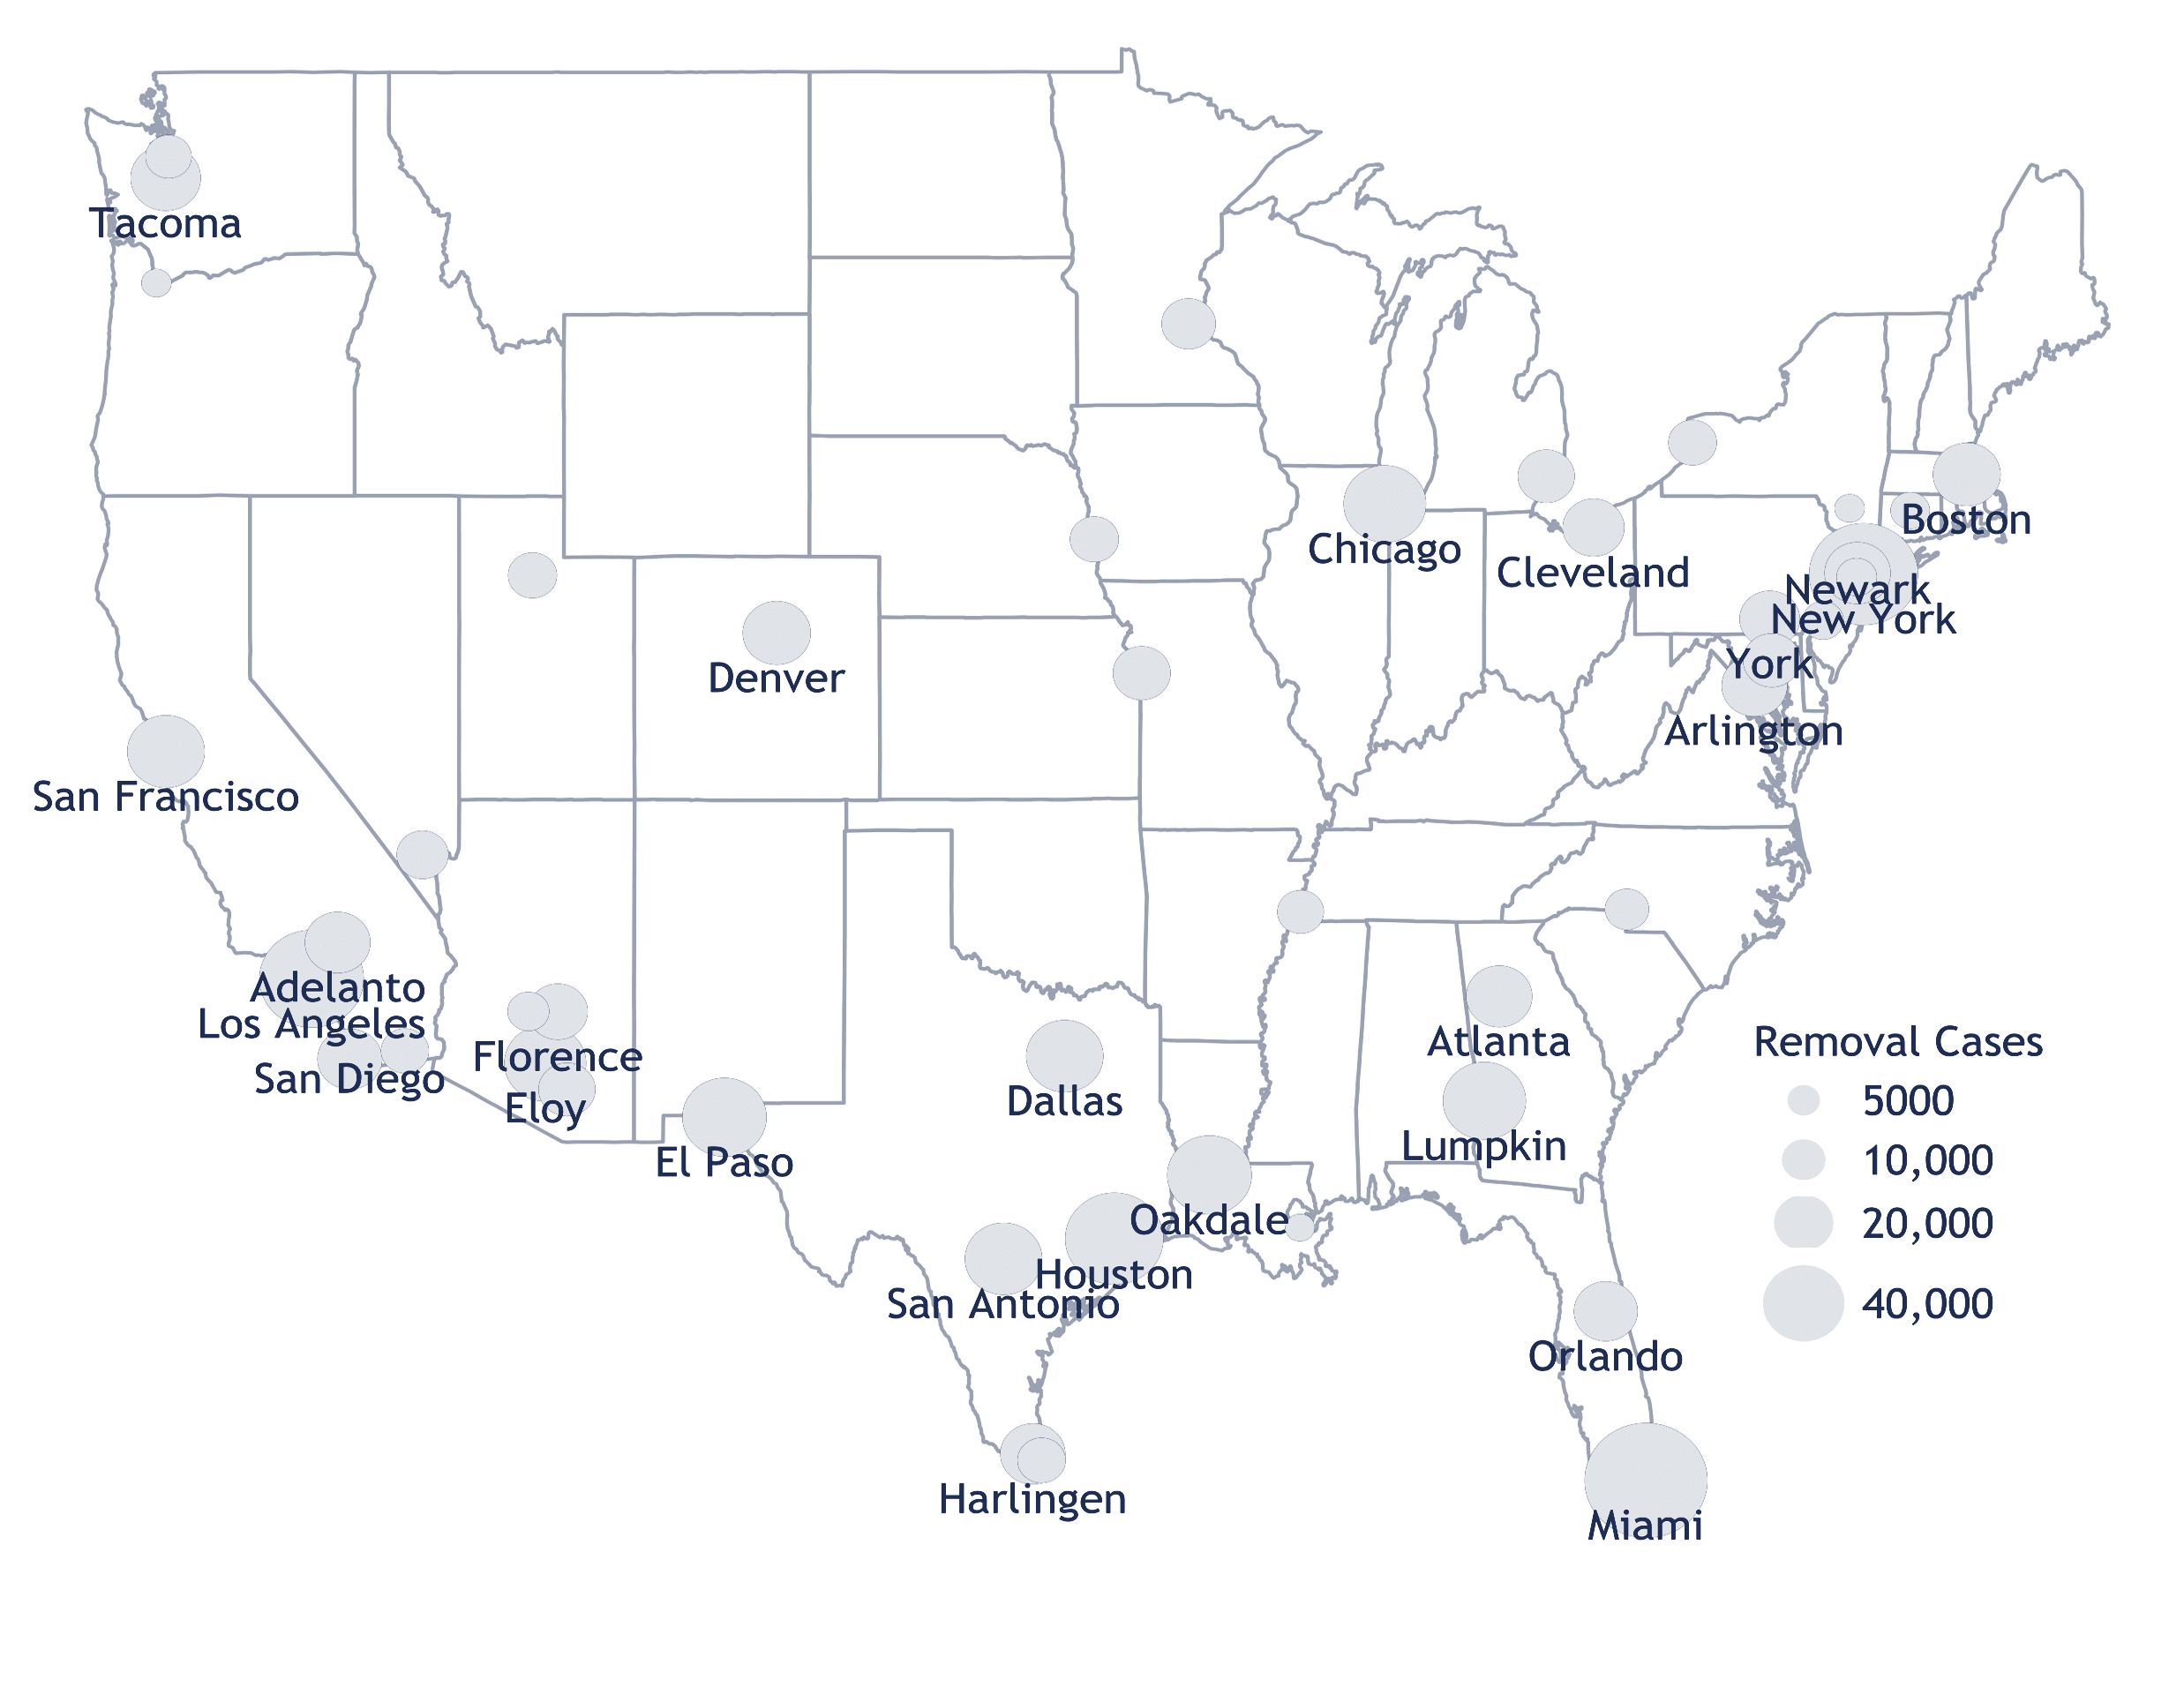
From 2007 to 2012, over 1.2 million deportation cases were decided by U.S. immigration courts. As depicted in the map in Figure 2, these cases were unequally distributed across different jurisdictions. The largest circles on the map represent immigration courts that decided 40,000 or more cases during the study period, with smaller circles representing courts with correspondingly fewer cases.
Figure 2: Immigration Courts, by Volume and Location, 2007–2012
Cases Concentrated in Courts on East Coast and Along Southern Border
Source: Authors’ analysis of Executive Office for Immigration Review data, 2007–2012.
Figure 2 shows that many of the busiest courts in the country are concentrated along the Southwest border and the East coast. Only three cities—Chicago, Cleveland, and Detroit—handled the majority of all cases adjudicated in the Midwest. Few of the over 1.2 million removal cases were decided at courts located in the Northwest.
Not only were immigration removal cases unevenly distributed among the different court jurisdictions, but each court also had different levels of attorney representation. Given that detention status is so interrelated with whether an immigrant is represented, it is useful to separately examine detained and nondetained representation rates when looking at court jurisdictions.
Figure 3 shows levels of representation for nondetained immigrants in the 20 court locations that decided the most nondetained cases during the six-year period studied. The share of nondetained immigrants with counsel across all cities was 66 percent.
Figure 3: Nondetained Representation Rates in 20 Jurisdictions, 2007–2012
|
|
Percent Represented |
Total Cases |
|---|---|---|
|
New York, NY |
87% |
67,943 |
|
San Francisco, CA |
78% |
22,644 |
|
Newark, NJ |
74% |
16,705 |
|
Houston, TX |
69% |
16,694 |
|
Boston, MA |
69% |
19,258 |
|
Los Angeles, CA |
67% |
59,368 |
|
Denver, CO |
67% |
9,876 |
|
Philadelphia, PA |
66% |
8,874 |
|
Seattle, WA |
65% |
11,334 |
|
Baltimore, MD |
64% |
15,634 |
|
Orlando, FL |
63% |
22,837 |
|
Dallas, TX |
61% |
13,323 |
|
Miami, FL |
59% |
57,697 |
|
Memphis, TN |
56% |
11,411 |
|
Chicago, IL |
56% |
19,327 |
|
Arlington, VA |
55% |
17,800 |
|
San Antonio, TX |
52% |
11,230 |
|
Charlotte, NC |
50% |
9,594 |
|
Atlanta, GA |
47% |
18,473 |
|
Kansas City, MO |
47% |
9,271 |
Source: Authors’ analysis of Executive Office for Immigration Review data, 2007–2012.
In the busiest twenty nondetained court jurisdictions, representation rates reached as high as 87 percent in New York City and 78 percent in San Francisco. At the low end, only 47 percent of nondetained immigrants in Atlanta, Georgia, and Kansas City, Missouri, secured representation. In other words, the representation rate for nondetained immigrants in New York City was a full 40 percent higher than in Atlanta or Kansas City.
Similar disparities existed across courts handling detained cases. Figure 4 lists the twenty court jurisdictions that decided the highest number of detained cases during the six-year period studied. The share of detained immigrants with counsel across all cities was 14 percent.
Figure 4: Detained Representation Rates in 20 Jurisdictions, 2007–2012
|
|
Percent Represented |
Total Cases |
|---|---|---|
|
El Paso, TX |
22% |
39,648 |
|
Miami, FL |
20% |
33,982 |
|
San Antonio, TX |
20% |
24,822 |
|
Los Fresnos, TX |
18% |
12,714 |
|
York, PA |
18% |
20,861 |
|
San Diego, CA |
17% |
16,674 |
|
San Francisco, CA |
15% |
13,635 |
|
Harlingen, TX |
14% |
17,432 |
|
Adelanto, CA |
13% |
24,996 |
|
Houston, TX |
13% |
42,706 |
|
Chicago, IL |
12% |
22,178 |
|
Dallas, TX |
9% |
22,732 |
|
Denver, CO |
9% |
17,530 |
|
Florence, AZ |
9% |
20,664 |
|
Eloy, AZ |
8% |
40,617 |
|
Tacoma, WA |
8% |
29,143 |
|
Oakdale, LA |
6% |
42,521 |
|
Lumpkin, GA |
6% |
41,674 |
|
Cleveland, OH |
5% |
13,479 |
|
Tucson, AZ |
0% |
17,053 |
Source: Authors’ analysis of Executive Office for Immigration Review data, 2007–2012.
Within these jurisdictions with a high volume of detained cases, the proportion of detained immigrants represented fluctuated by as much as 22 percentage points. The highest detained representation rate of 22 percent was in El Paso, Texas, while the lowest rate of 0 percent was in Tucson, Arizona. Further investigation revealed that during the time of this study immigration judges in Tucson utilized a “quick court” in which expedited hearings are held in Border Patrol detention stations and judges’ chambers. The end result was the lowest detained representation rate in the country and lightning-fast processing times (97 percent of detained cases in Tucson were decided within one day).
Immigrants with hearings in small cities face additional barriers
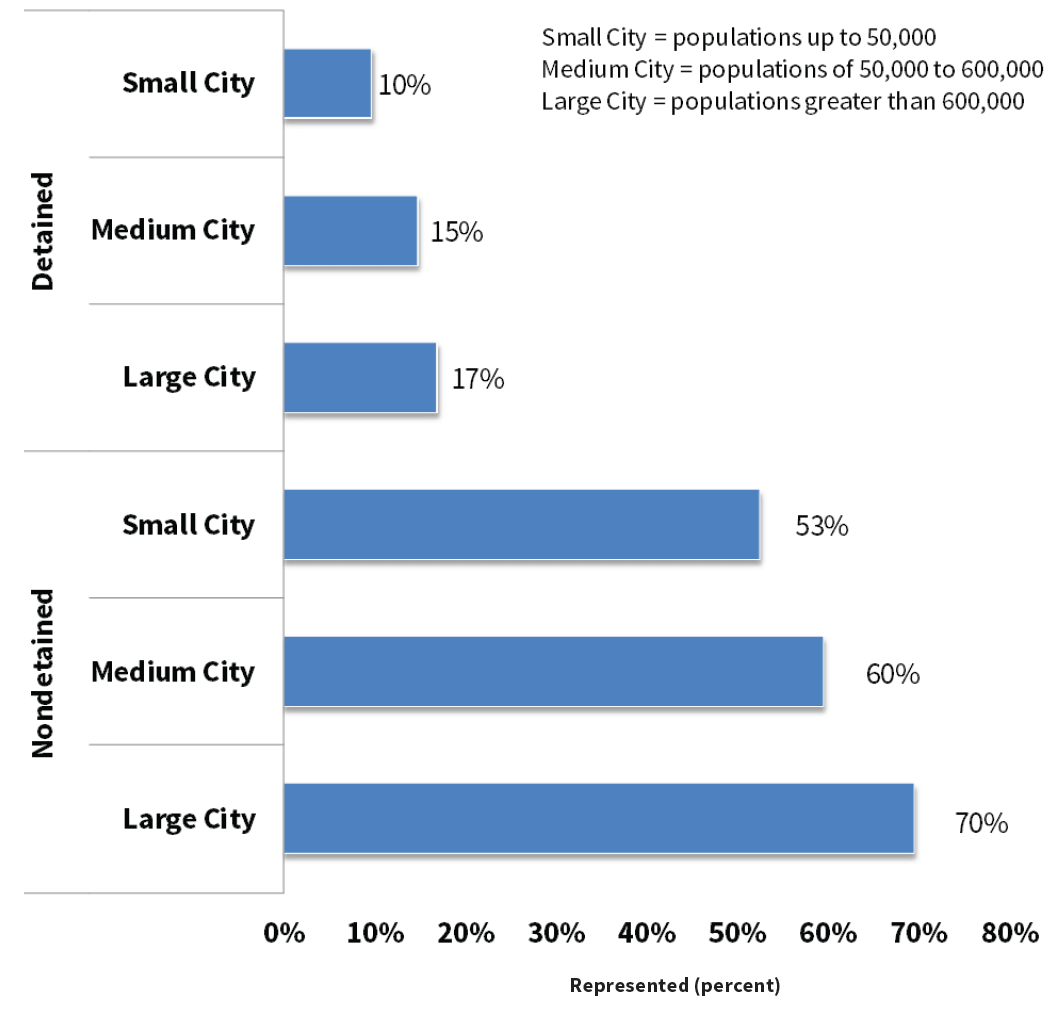
Finding counsel was particularly challenging for those with cases in immigration courts located in small cities with populations of less than 50,000. Strikingly, over the six-year period studied, immigrants with their cases heard in small cities were the least likely to obtain counsel. Immigrants with court hearings in large cities had a representation rate of 47 percent, more than four times greater than the 11 percent representation rate of those with hearings in small cities.
A more detailed description of this city size analysis of representation—broken down by detention status—is displayed in Figure 5. Notably, both detained and nondetained immigrants were less likely to obtain counsel when their case was decided in a small city, as compared to a medium or large city. Immigrants detained in small cities had the lowest representation rate of all—only 10 percent over the six-year period studied.
Figure 5: Representation Rates in Removal Cases, by City Size and Detention Status, 2007–2012
Immigrants in Small Cities Much Less Likely to Have Attorneys
Source: Authors’ analysis of Executive Office for Immigration Review data, 2007–2012.
Furthermore, detained immigrants, who were already less likely to obtain representation, were also disproportionately concentrated in small cities. Approximately one-third of all detained cases were heard in these remote court locations, further intensifying the obstacles detained immigrants face in accessing counsel.
These statistics also reflect the reality that few immigration attorneys practice in small cities. Analyzing attorney records in the court files revealed that some cities where large numbers of detained immigration cases are decided had few or no immigration attorneys with practices based in the same city as the detention center. For example, Lumpkin, Georgia’s immigration court, which completed 42,006 removal cases during the study period, did not have a single attorney with his or her practice located in that city. Oakdale, Louisiana’s immigration court, which completed 43,650 cases, had only four practicing immigration attorneys based in the city. This means that the vast majority of immigration attorneys who do take cases in these remote courts must travel long distances to attend court hearings, further hindering access to counsel by increasing the costs associated with providing legal services.
Representation rates vary widely based on the nationality of the immigrant
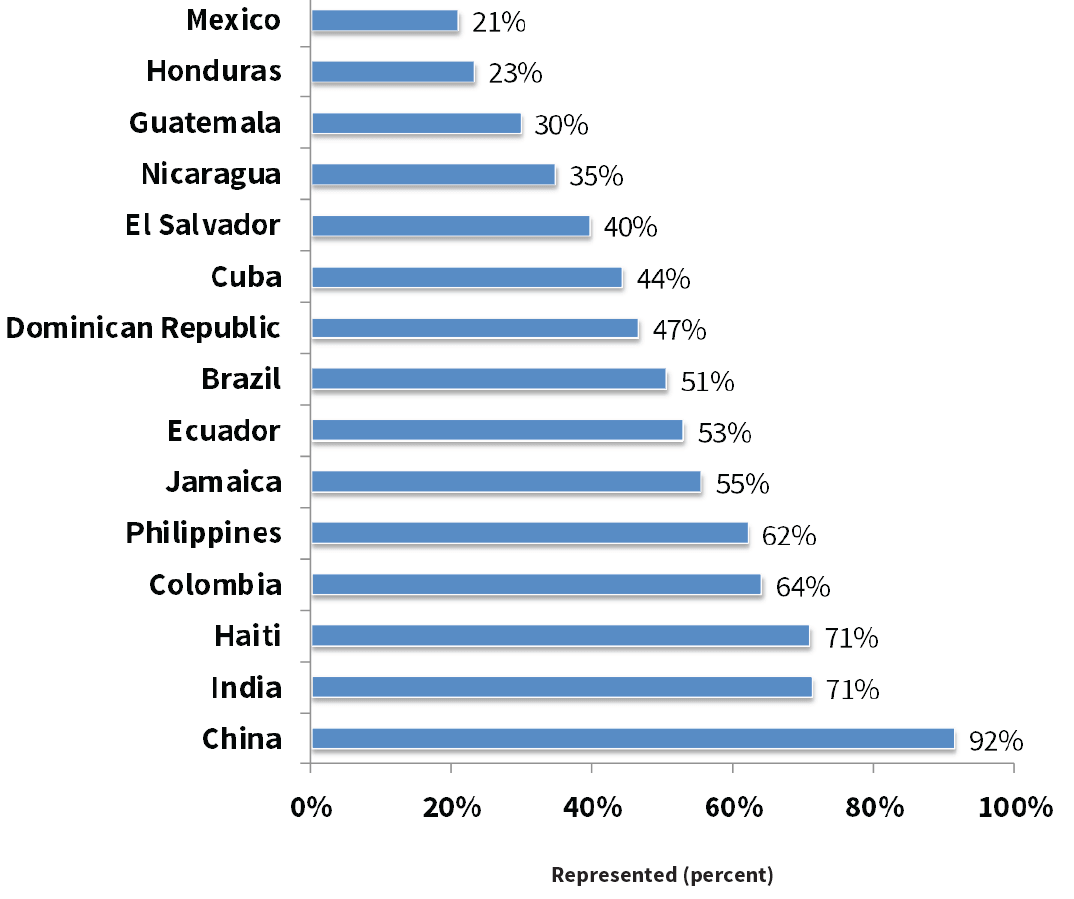
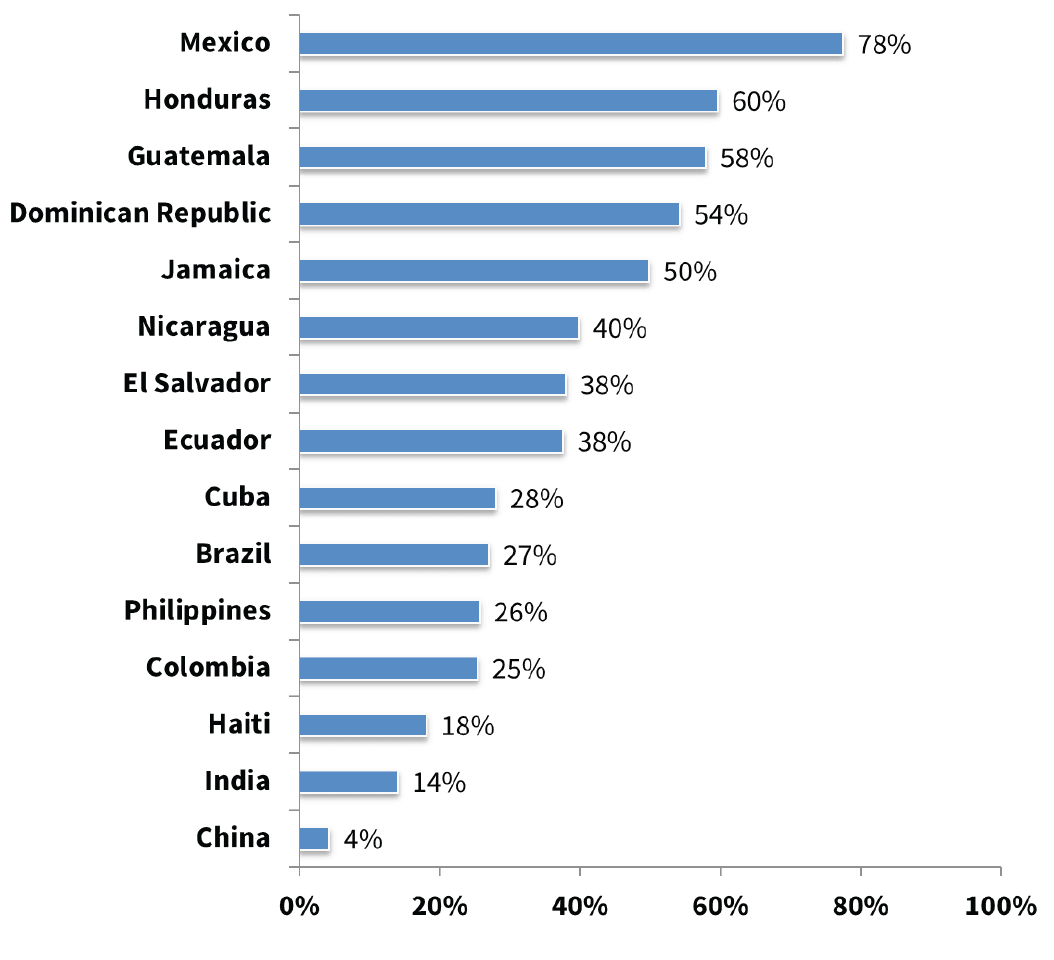
Immigrants of different nationalities also had very different representation rates. The 15 most common countries of origin in removal cases and their respective representation rates are shown in Figure 6. Mexican nationals were by far the largest nationality group in removal proceedings, but they were also the least likely to be represented by counsel. Only 21 percent of the 574,448 Mexicans who were put in removal proceedings had an attorney. In contrast, 92 percent of Chinese and 71 percent of Haitian and Indian nationals in removal proceedings secured counsel.
Figure 6: Representation Rates Among Nationalities with Greatest Number of Removal Cases Decided, 2007–2012
Mexican Nationals Least Likely to Be Represented, Chinese Nationals the Most Likely
Source: Authors’ analysis of Executive Office for Immigration Review data, 2007–2012.
Immigrants of different nationalities also had very different detention rates, as illustrated in Figure 7. Mexican nationals in removal proceedings were detained 78 percent of the time. Similarly, Central American immigrants were less likely to have an attorney and more likely to be in detention. Twenty-three percent of Hondurans were represented and 60 percent were detained; 30 percent of Guatemalans were represented and 58 percent were detained. In contrast, Chinese nationals in immigration proceedings were only detained 4 percent of the time, Indians 14 percent of the time, and Haitians 18 percent of the time, and nationals from those three countries were much more likely than Mexicans and Central Americans to be represented by counsel. These findings raise compelling questions as to why Mexican nationals and other Latinos were more likely to be in immigration detention.
Figure 7: Detention Rates Among Nationalities with Greatest Number of Removal Cases Decided, 2007–2012
Mexicans Most Likely to Be Detained, Chinese the Least Likely
Source: Authors’ analysis of Executive Office for Immigration Review data, 2007–2012.
It is important to acknowledge that the difference in representation rates across nationalities could be attributed to a number of additional factors. Economic status certainly plays a role since the scarcity of pro bono resources demands that the majority of immigrants who obtain representation must be able to afford an attorney. The ability to find an attorney could also be influenced by the strength of the social networks that different immigrant groups have to assist them in finding counsel.
The fact that so few immigrants in deportation proceedings are represented by counsel is important because having an attorney is associated with successful immigration outcomes. The data show that immigrants with legal counsel were more likely to be released from detention, avoid being removed in absentia, and seek and obtain immigration relief.
Two Stages of Immigration Removal
In this paper, “removal” refers to a court proceeding in which an immigration judge determines whether an immigrant apprehended while attempting to enter the United States may remain, or whether one already in the United States must be deported.
Removal is a two-stage process. In the first stage of the process, the Department of Homeland Security (DHS) files a charging document (known as a “Notice to Appear”) against the immigrant (referred to in immigration court as the “respondent”), and the judge decides whether to sustain those charges. If the Notice to Appear does not state a valid ground for removal, the judge must terminate the case. For example, the judge will terminate the case if the respondent is a U.S. citizen. For cases that are terminated, the respondent will generally be allowed to remain in the United States.
If the immigrant is found to be removable, the second stage of the proceeding begins. In this stage, the immigrant will be ordered removed unless he or she pursues an application for relief. For example, an immigrant may be eligible for asylum based on a well-founded fear of persecution on certain grounds. Alternatively, an immigrant may obtain a limited form of relief called “cancellation of removal” based on, among other factors, a long-term residence in the United States. If the judge grants the application for relief, the immigrant is allowed to remain in the United States. If, however, the application for relief is denied, the immigrant will be required to leave the United States.
Immigrants with representation are more likely to be released from detention
Immigrants in detention were more likely to secure release with the aid of an attorney. For those immigrants who are eligible for release on bond or other conditions, immigration judges may hold a custody hearing if one is requested. When judges rule on an immigrant’s request for release prior to trial, they must weigh numerous factors related to risk of flight and public safety. Immigrants who are granted bond will be released if they are financially able to post the required amount. Unfortunately, some immigrants remain detained because they are simply unable to afford the bond amount set by the judge.
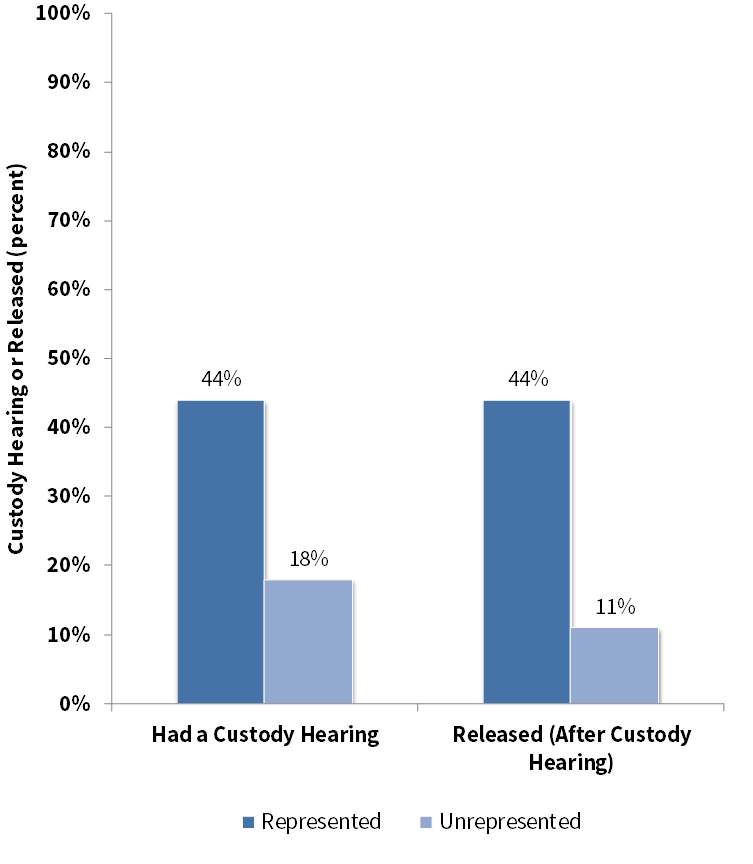
Overall, as the left side of Figure 8 displays, 44 percent of represented detainees were granted a custody hearing before the judge, compared to only 18 percent of detainees without counsel. This increase may indicate that having an attorney is helpful in navigating the complex rules governing eligibility for custody hearings. In addition, once a custody hearing was held, represented litigants were more likely to be released from custody. Of those respondents with custody hearings, as seen on the right side of Figure 8, 44 percent of represented respondents were released, compared to only 11 percent of unrepresented respondents.
Figure 8: Frequency of Custody Hearings and Release, by Representation Status, 2007–2012
Detained Immigrants with Attorneys More Likely to Have a Custody Hearing and to Be Released
Source: Authors’ analysis of Executive Office for Immigration Review data, 2007–2012.
In conclusion, this analysis suggests that early involvement of attorneys in detained cases is associated with an increased likelihood of release from detention. This finding of a correlation between release and representation is especially important because detaining immigrants is enormously expensive for the federal government. In fiscal year 2016, Congress allocated more than $2 billion for detention. These data thus support other research concluding that a government-funded public defender system for immigrants could potentially pay for itself by helping to reduce court and detention costs associated with having immigrants pursue their immigration cases without the advice of counsel.
Immigrants with representation are more likely to appear in court
Immigrants who are not detained must appear in court at a later date for their immigration removal hearing. If, however, the immigrant fails to appear for one or more of these hearings, the judge may enter a removal order without the immigrant being present. These removal orders issued when the immigrant fails to appear are referred to as “in absentia removal orders.”
The data analyzed for this report show that immigrants who were represented by attorneys were far more likely to attend their immigration court hearings and thus avoid these in absentia orders. Ninety percent of unrepresented immigrants with removal orders were removed in absentia versus only 29 percent of their represented counterparts with removal orders. This finding suggests that representation by counsel is strongly associated with immigrants coming to court. When immigrants appear in immigration court, immigration judges can more effectively do their jobs.
Immigrants with representation are more likely to win their removal cases
Not only are represented immigrants less likely to be ordered removed in absentia, they are also more likely to win their removal cases.
Success in a removal case can happen in either of the two stages of immigration proceedings. The immigrant can succeed in the first stage of the removal process if the judge terminates the case because the charges do not state a valid ground for removal. The immigrant can also succeed in the second stage of the removal process if the judge grants the immigrant relief from deportation so that he or she can remain lawfully in the United States.
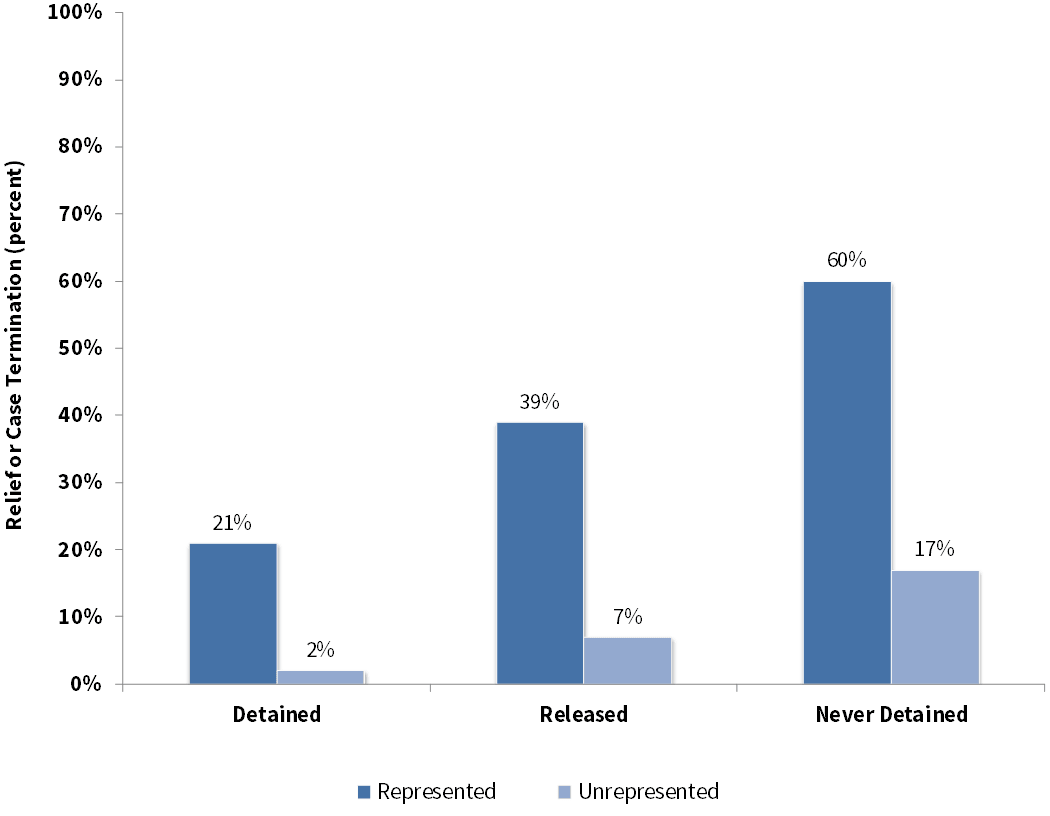
Combining terminations and grants of relief as a measure of success, Figure 9 shows that both detained and nondetained immigrants with legal counsel had higher success rates than those without representation. Depending on custody status, representation was associated with a 19 to 43 percentage point boost in rate of case success. The columns on the left show that detained immigrants with representation, when compared to their unrepresented counterparts, were ten-and-a-half times more likely to succeed. The center columns show that immigrants who were released from detention and had a lawyer were five-and-a-half times more likely to have their cases terminated or be granted relief than their counterparts. Finally, the columns on the right show that immigrants who were never detained were three-and-a-half times more likely to succeed. These findings suggest that having an attorney to help navigate the complex removal process enhances the chance of success in removal proceedings.
Figure 9: Successful Case Outcomes (Termination or Relief) in Removal Cases, by Detention and Representation Status, 2007–2012
Immigrants with Representation More Likely to Succeed
Source: Authors’ analysis of Executive Office for Immigration Review data, 2007–2012.
Immigrants with representation are more likely to seek and obtain relief from deportation
Immigrants facing removal cannot obtain relief unless they apply for it. Yet the data reveal that immigrants without counsel were also far less likely to pursue relief. And, if they did pursue relief, they were less likely than those with counsel to prevail.
Figure 10 reports these patterns in applying for relief across every detention status. For example, 78 percent of never detained respondents with counsel applied for relief, compared to only 15 percent of never detained respondents without counsel. Among the detained, 32 percent of those with counsel applied for relief, compared to only 3 percent of detained respondents without counsel. Similar patterns exist among those released from detention: 56 of those with counsel applied for relief, compared to only 10 percent of those without counsel.
Figure 10: Applications for Relief in Removal Cases, by Detention and Representation Status, 2007–2012
Immigrants with Representation More Likely to Apply for Relief

Source: Authors’ analysis of Executive Office for Immigration Review data, 2007–2012.
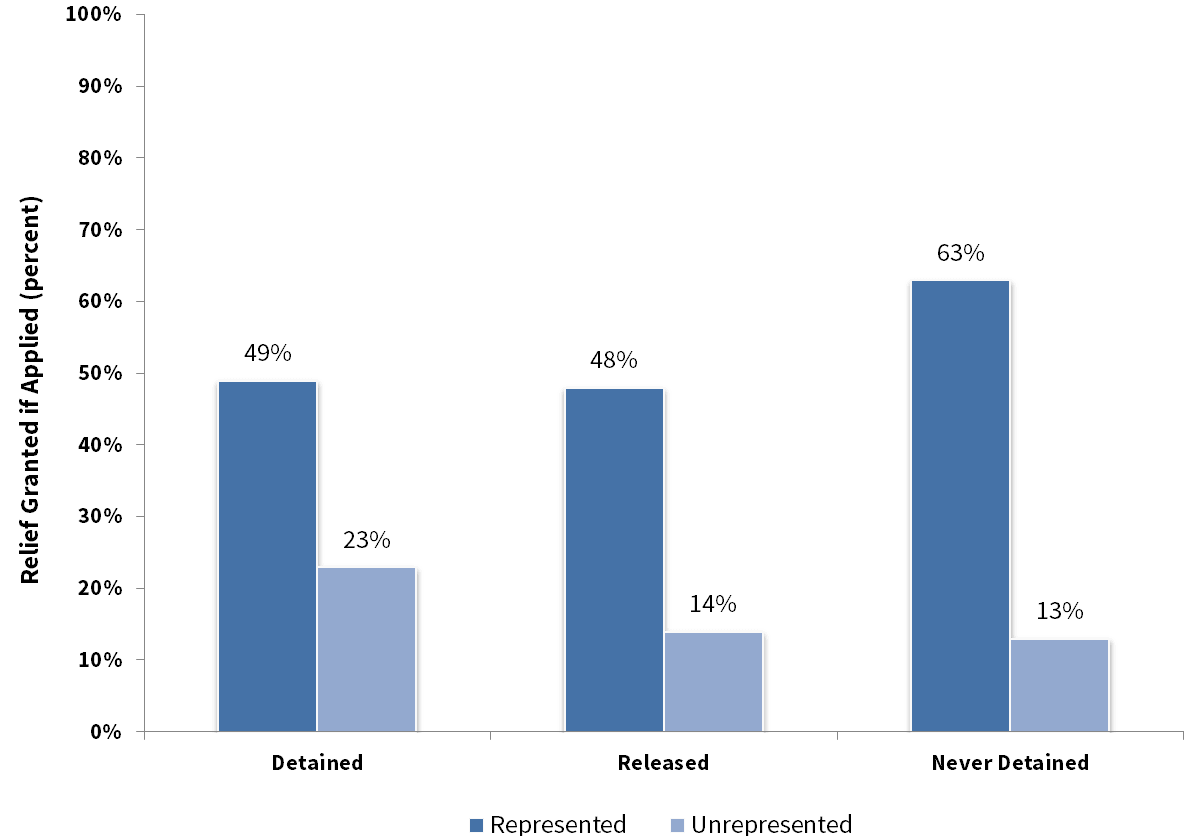
Once respondents passed this procedural step of submitting an application, represented respondents continued to outperform their unrepresented counterparts. Figure 11 contains these findings. Never detained respondents with counsel were almost five times more likely to win relief; released respondents with counsel were almost three-and-a-half times more likely to win relief; and detained respondents with counsel were over two times more likely to win relief.
Figure 11: Applications for Relief Granted, by Detention and Representation Status, 2007–2012
Immigrants with Representation More Likely to Be Granted Relief
Source: Authors’ analysis of Executive Office for Immigration Review data, 2007–2012.
Examining the absolute numbers of immigrants who won relief in immigration court underscores even more dramatically the crucial role of attorneys. As seen in Figure 12, during the six-year period from 2007 to 2012, a total of 272,352 immigrants in removal proceedings applied for relief from removal. Among these immigrants seeking relief, just over half (144,544 total) were granted the relief they sought by the immigration judge. Yet, only 6,597 of these respondents, or two percent of those who applied for relief, succeeded without an attorney. This dismal statistic reveals just how rare it is for immigrants without counsel to present and win their claims in immigration court.
Figure 12: Applications and Grants of Relief, by Representation Status, 2007–2012
Very Few Immigrants Obtained Relief Without Counsel

Source: Authors’ analysis of Executive Office of Immigration Review data, 2007–2012.
In short, at every stage in immigration court proceedings, representation was associated with considerably more successful case outcomes.
By reviewing over 1.2 million deportation cases decided across the United States over a six-year period, this report provides an urgent portrait of the lack of counsel in immigration courts. In it, we reveal that 63 percent of all immigrants went to court without an attorney. Detained immigrants were even less likely to obtain counsel—86 percent attended their court hearings without an attorney. For immigrants held in remote detention centers, access to counsel was even more severely impaired—only 10 percent of immigrants detained in small cities obtained counsel.
Addressing the barriers to obtaining legal counsel is important because having an attorney was strongly associated with positive outcomes. Represented immigrants were more likely to be released from detention. Represented immigrants were more likely to have their cases terminated, to seek relief from removal, and to obtain the relief they sought. In fact, detained immigrants with counsel, when compared to detained immigrants without counsel, were ten-and-a-half times more likely to succeed; released immigrants with counsel were five-and-a-half times more likely to succeed; and never detained immigrants with counsel were three-and-a-half times more likely to succeed.
This report provides a data-driven context for future discussion of the pivotal issue of access to counsel in U.S. immigration courts. Preserving the integrity and fairness of the national deportation system demands serious thinking about how to ensure that immigrants facing removal are provided a meaningful opportunity to be represented by counsel at every stage of their proceedings.