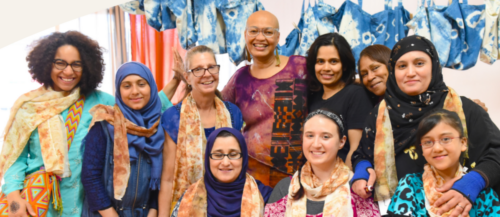
Montana has a small but growing community of immigrants, many of whom emigrated from Canada and Mexico. While only 2 percent of Montana’s population was born in another country, foreign-born residents help support Montana’s economy across sectors. Immigrants make up a vital, educated share of the state’s labor force, with a third holding a college or higher degree.
Many of Montana’s immigrants lend their expertise as architects and engineers, accounting for 5 percent of residents working in the field. Nearly a third of all Montanans working in management of companies and enterprises are immigrants. As neighbors, business owners, taxpayers, and workers, immigrants are an integral part of Montana’s diverse and thriving communities and make extensive contributions that benefit all.
Two percent of Montana residents are immigrants, while about 4 percent of residents are native-born U.S. citizens with at least one immigrant parent.
- In 2018, 23,366 immigrants (foreign-born individuals) comprised 2 percent of the population.
- Montana was home to 13,538 women, 7,889 men, and 1,939 children who were immigrants.
- The top countries of origin for immigrants were Canada (15 percent of immigrants), Mexico (15 percent), Germany (7 percent), China (5 percent), and Vietnam (5 percent).
- In 2018, 43,066 people in Montana (4 percent of the state’s population) were native-born Americans who had at least one immigrant parent.
Almost three out of five immigrants in Montana are naturalized U.S. citizens.
- 13,568 immigrants (58 percent) had naturalized as of 2018, and 4,621 immigrants were eligible to become naturalized U.S. citizens in 2017.
- Nearly all (96 percent) immigrants reported speaking English “well” or “very well.”
Most immigrants in Montana have pursued education at or above the college level.
- One-third (33 percent) of adult immigrants had a college degree or more education in 2018, while 15 percent had less than a high school diploma.
|
Education Level |
Share (%) of All Immigrants |
Share (%) of All Natives |
|---|---|---|
|
College degree or more |
33 |
32 |
|
Some college |
28 |
34 |
|
High school diploma only |
23 |
28 |
|
Less than a high school diploma |
15 |
6 |
|
Source: U.S. Census Bureau, 2018 American Community Survey 1-Year Estimates. |
||
Hundreds of U.S. citizens in Montana live with at least one family member who is undocumented.
- Fewer than 5,000 undocumented immigrants comprised 12 percent of the immigrant population and less than half a percent of the total state population in 2016.
- 1,715 people in Montana, including 921 U.S. citizens, lived with at least one undocumented family member between 2010 and 2014.
- During the same period, 531 children in the state were U.S. citizens living with at least one undocumented family member.
Montana is home to dozens of Deferred Action for Childhood Arrivals (DACA) recipients.
- 70 active DACA recipients lived in Montana as of March 2020, while DACA has been granted to 64 people in total since 2012.
Immigrants are important members of Montana’s labor force across a range of industries.
- 12,183 immigrant workers comprised 2 percent of the labor force in 2018.
- Immigrant workers were most numerous in the following industries:
|
Industry |
Number of Immigrant Workers |
|---|---|
|
Health Care and Social Assistance |
3,380 |
|
Accommodation and Food Services |
2,917 |
|
Educational Services |
1,900 |
|
Retail Trade |
1,295 |
|
Agriculture, Forestry, Fishing, and Hunting |
1,172 |
|
Source: Analysis of the U.S. Census Bureau’s 2018 American Community Survey 1-year PUMS data by the American Immigration Council. |
|
- The largest shares of immigrant workers were in the following industries:
|
Industry |
Immigrant Share (%) |
|---|---|
|
Management of Companies and Enterprises |
31 |
|
Accommodation and Food Services |
4 |
|
Health Care and Social Assistance |
4 |
|
Educational Services |
3 |
|
Arts, Entertainment, and Recreation |
3 |
|
Source: Analysis of the U.S. Census Bureau’s 2018 American Community Survey 1-year PUMS data by the American Immigration Council. |
|
Immigrants are an integral part of the Montana workforce in a range of occupations.
- In 2018, immigrant workers were most numerous in the following occupation groups:
|
Occupation Category |
Number of Immigrant Workers |
|---|---|
|
Food Preparation and Serving Related |
2,012 |
|
Sales and Related |
1,780 |
|
Educational Instruction and Library |
1,460 |
|
Building and Grounds Cleaning & Maintenance |
1,407 |
|
Office and Administrative Support |
1,407 |
|
Source: Analysis of the U.S. Census Bureau’s 2018 American Community Survey 1-year PUMS data by the American Immigration Council. |
|
- The largest shares of immigrant workers were in the following occupation groups:
|
Occupation Category |
Immigrant Share (%) |
|---|---|
|
Architecture and Engineering |
5 |
|
Farming, Fishing, and Forestry |
5 |
|
Building and Grounds Cleaning & Maintenance |
5 |
|
Educational Instruction and Library |
5 |
|
Healthcare Support |
4 |
|
Source: Analysis of the U.S. Census Bureau’s 2018 American Community Survey 1-year PUMS data by the American Immigration Council. |
|
- Undocumented immigrants comprised 1 percent of Montana’s workforce in 2016.
Immigrants in Montana have contributed tens of millions of dollars in taxes.
- Immigrant-led households in the state paid $78 million in federal taxes and $34.5 million in state and local taxes in 2018.
- Montana DACA recipients and DACA-eligible individuals paid an estimated $140,000 in state and local taxes in 2018.
As consumers, immigrants add hundreds of millions of dollars to Montana’s economy.
- Montana residents in immigrant-led households had $401.4 million in spending power (after-tax income) in 2018.
Immigrant entrepreneurs in Montana generate tens of millions of dollars in business revenue.
- 1,181 immigrant business owners accounted for 1 percent of all self-employed Montana residents in 2018 and generated $28.2 million in business income.