New CBO Report Underscores Diverse Contributions of Foreign-Born Workers
A recent report from the Congressional Budget Office (CBO) underscores not only the diversity of the foreign-born labor force in the United States, but also the myriad roles that immigrant workers play in the U.S. economy. The report, which analyzes data from the Current Population Survey, finds that 15.5 percent of the U.S. labor force was foreign-born in 2009, up slightly from 14.5 percent in 2004. Moreover, immigrant workers and their native-born counterparts differ significantly in terms of occupation and education, as well as where in the country they live. As other, more detailed analyses have confirmed, this suggests that immigrants and natives are filling different niches in the U.S. labor market and are therefore not in direct competition with each other for most jobs.
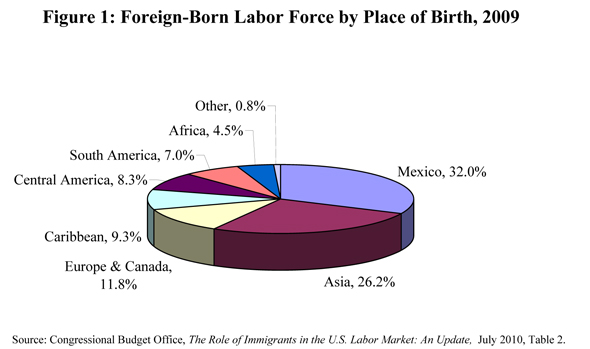
Nearly one-third of immigrant workers are from Mexico, and more than one-quarter from Asia.
- According to the CBO’s analysis, nearly one-third (32.0 percent) of all foreign-born workers were from Mexico as of 2009, while more than one-quarter (26.2 percent) came from Asian countries {Figure 1}.
- One-in-nine foreign-born workers (11.8 percent) were from Europe and Canada in 2009, while one-in-eleven (9.3 percent) came from the Caribbean {Figure 1}.
Immigrant and native-born workers differ in their occupational profiles.
- The top occupation for foreign-born workers age 25-64 was construction and extraction in 2009, accounting for 8.8 percent of the total foreign-born labor force, followed by production occupations (8.7 percent); building and grounds cleaning and maintenance (8.5 percent); and sales (8.4 percent) {Figure 2}.

- The top occupation for native-born workers age 25-64 was office and administrative support in 2009, accounting for 13.8 percent of the total native-born labor force, followed by management (12.9 percent); sales (10.5 percent); and education, training, and library occupations (7.0 percent) {Figure 3}.

Immigrant and native-born workers differ significantly in their educational profiles.
- 30 percent of native-born workers age 25+ had some college education short of a bachelor’s degree in 2009, compared to only 17 percent of foreign-born workers {Figure 4}.
- More than one-quarter (27 percent) of foreign-born workers age 25+ lacked a high-school diploma in 2009, compared to only 6 percent of native-born workers {Figure 4}.

Immigrant workers from Asia, Europe, Canada, and Africa are the most educated.
- On average, native-born workers had 13.9 years of education in 2009, compared to 12.5 years for foreign-born workers as a whole {Figure 5}.
- Asian immigrant workers had the most years of education (14.8), followed by European and Canadian immigrants (14.7 years), African immigrants (14.3 years), and South American immigrants (13.5) {Figure 5}.

Most immigrant and native-born workers live in different states.
- 62.5% of foreign-born workers lived in only six states in 2009: California, New York, Florida, Texas, New Jersey, and Illinois {Figure 6}. In comparison, only 34.6 percent of native-born workers lived in those states {Figure 7}.