- Fact Sheet
Immigrants in South Dakota
Published
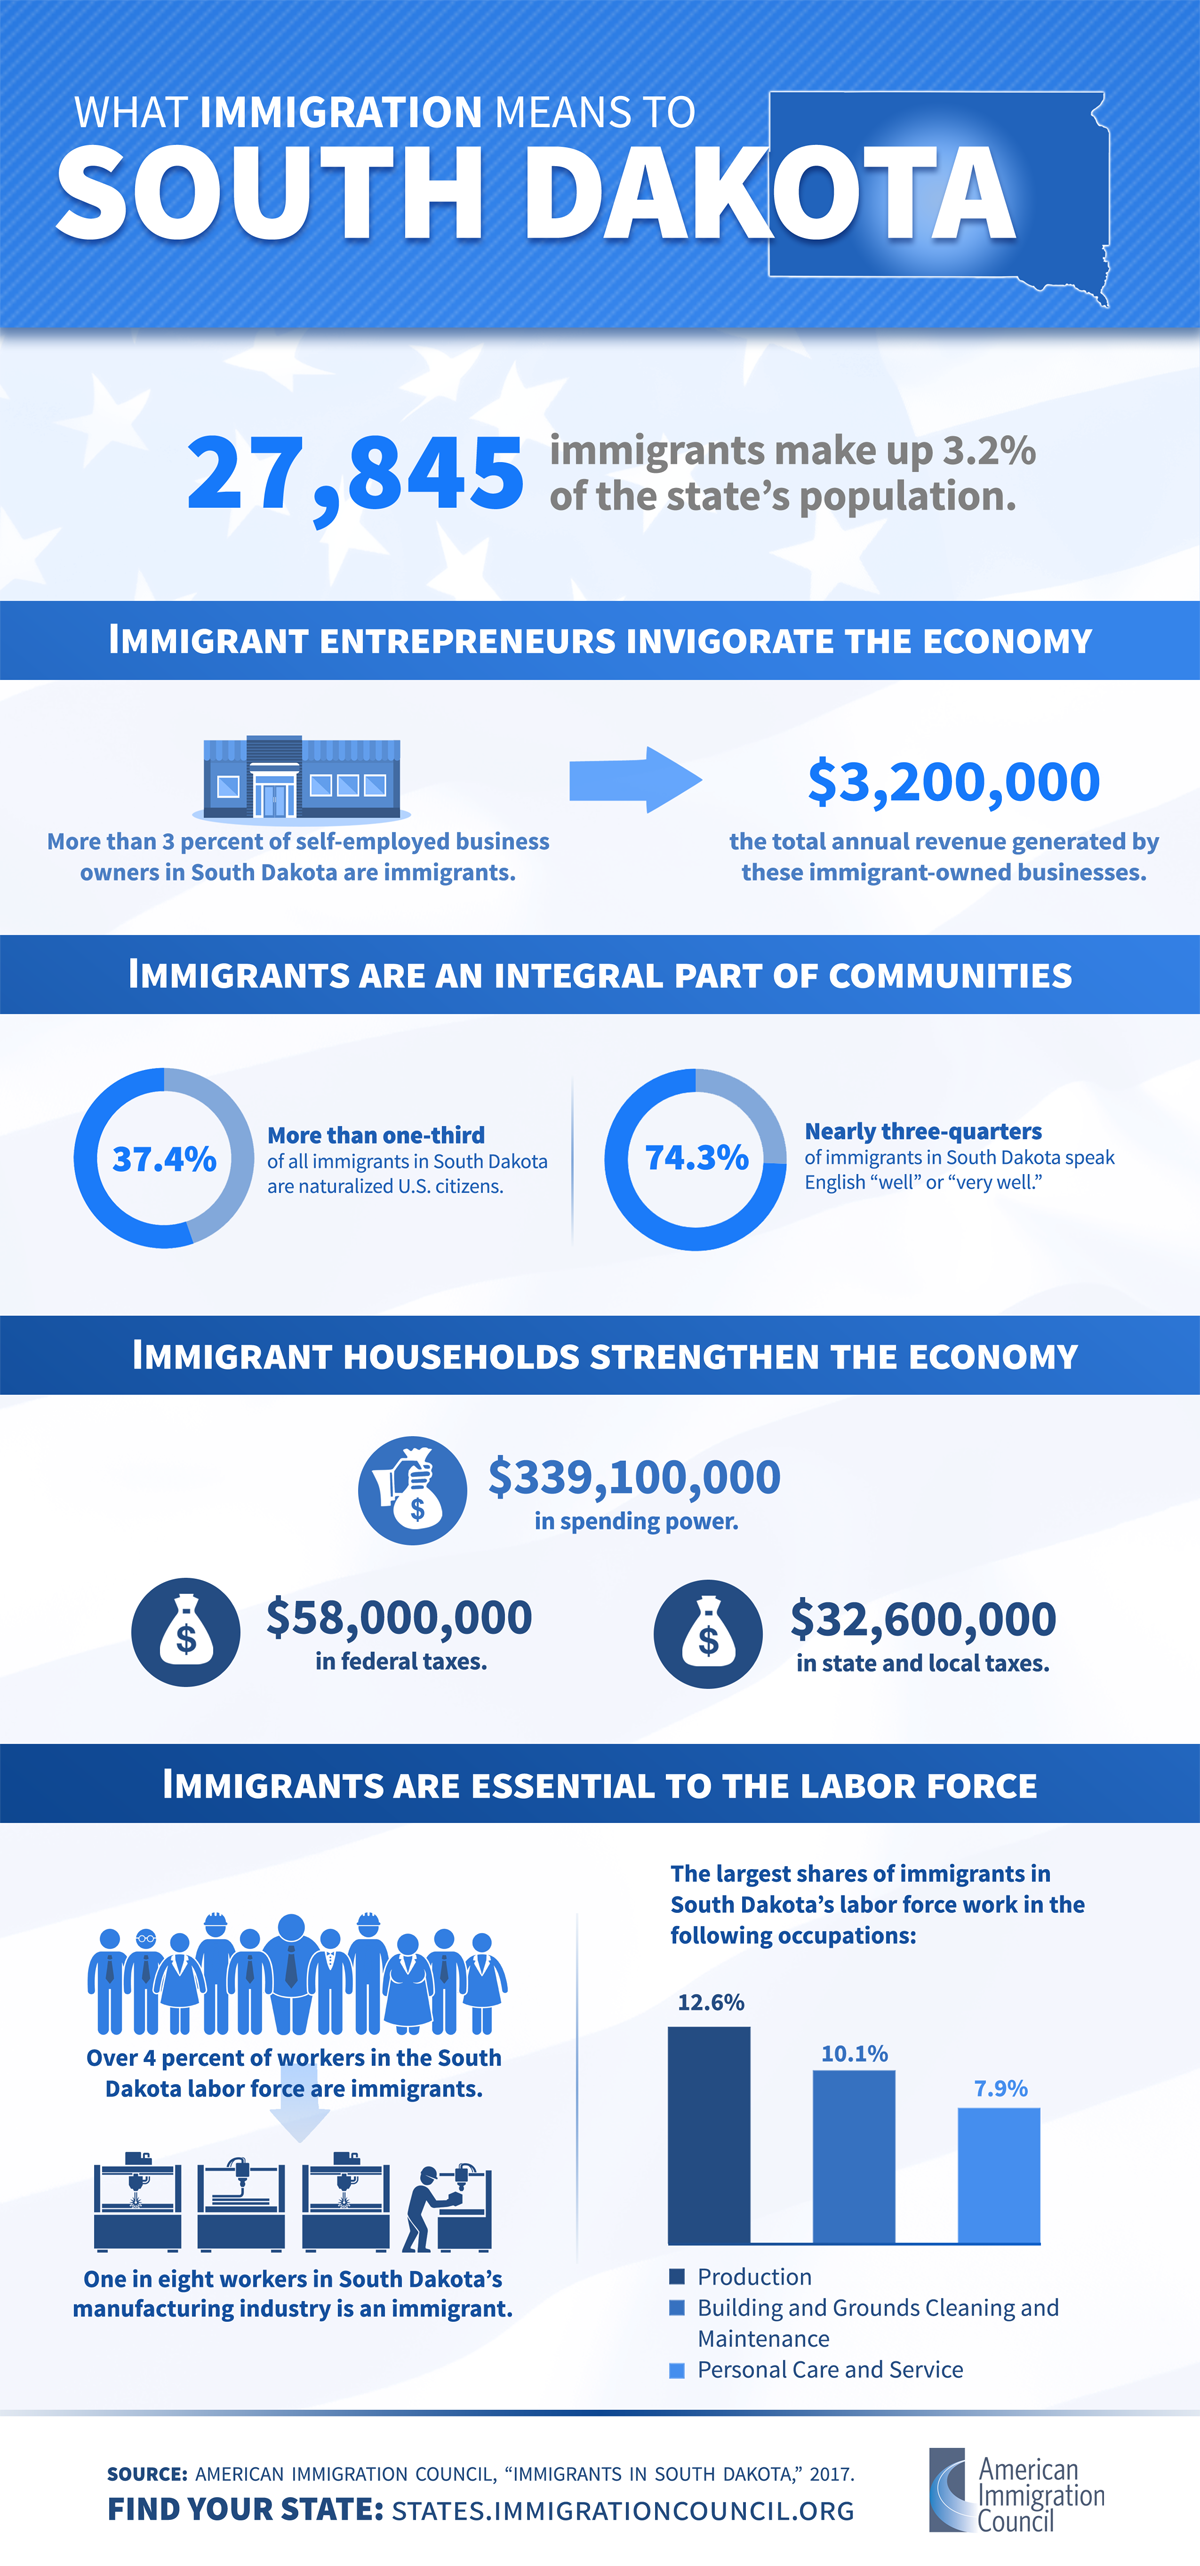
South Dakota has a small but growing immigrant community, with many emigrating from Guatemala, the Philippines, and Mexico. While a small share of South Dakota’s population was born in another country, foreign-born residents support the state’s economy across sectors. Immigrants make up a critical share of the state’s labor force. For example, 16 percent of all residents working in the manufacturing industry are immigrants, as are 11 percent of the state’s workers in healthcare support occupations. As neighbors, business owners, taxpayers, and workers, immigrants are an integral part of South Dakota’s diverse and thriving communities and make extensive contributions that benefit all.
Four percent of South Dakota residents are immigrants, while another 4 percent of residents are native-born U.S. citizens with at least one immigrant parent.
- In 2018, 35,175 immigrants (foreign-born individuals) comprised 4 percent of the population.
- South Dakota was home to 15,647 women, 15,622 men, and 3,906 children who were immigrants.
- The top countries of origin for immigrants were Guatemala (8 percent of immigrants), the Philippines (7 percent), Mexico (7 percent), Sudan (6 percent), and Ethiopia (5 percent).
- In 2018, 33,628 people in South Dakota (4 percent of the state’s population) were native-born Americans who had at least one immigrant parent.
More than a third of all immigrants in South Dakota are naturalized U.S. citizens.
- 12,693 immigrants (36 percent) had naturalized as of 2018, and 5,256 immigrants were eligible to become naturalized U.S. citizens in 2017.
- Four-fifths (81 percent) of immigrants reported speaking English “well” or “very well.”
Most immigrants in South Dakota have at least a high school education.
- One-fourth (26 percent) of adult immigrants had a college degree or more education in 2018, while under a third (30 percent) had less than a high school diploma.
|
Education Level |
Share (%) of All Immigrants |
Share (%) of All Natives |
|---|---|---|
|
College degree or more |
26 |
29 |
|
Some college |
13 |
33 |
|
High school diploma only |
31 |
31 |
|
Less than a high school diploma |
30 |
7 |
|
Source: U.S. Census Bureau, 2018 American Community Survey 1-Year Estimates. |
||
Thousands of U.S. citizens in South Dakota live with at least one family member who is undocumented.
- 5,000 undocumented immigrants comprised 19 percent of the immigrant population and 1 percent of the total state population in 2016.
- 6,762 people in South Dakota, including 3,609 U.S. citizens, lived with at least one undocumented family member between 2010 and 2014.
- During the same period, about 1 percent of children in the state were U.S. citizens living with at least one undocumented family member (2,485 children in total).
South Dakota is home to dozens of Deferred Action for Childhood Arrivals (DACA) recipients.
-
§ 190 active DACA recipients lived in South Dakota as of March 2020, while DACA has been granted to 241 people in total since 2012.
Immigrants are important members of the South Dakota labor force across industries.
- 21,148 immigrant workers comprised 5 percent of the labor force in 2018.
- Immigrant workers were most numerous in the following industries:
|
Industry |
Number of Immigrant Workers |
|---|---|
|
Manufacturing |
8,039 |
|
Health Care and Social Assistance |
3,978 |
|
Accommodation and Food Services |
2,575 |
|
Retail Trade |
2,101 |
|
Public Administration |
1,207 |
|
Source: Analysis of the U.S. Census Bureau’s 2018 American Community Survey 1-year PUMS data by the American Immigration Council. |
|
- The largest shares of immigrant workers were in the following industries:
|
Industry |
Immigrant Share (%) |
|---|---|
|
Manufacturing |
16 |
|
Accommodation and Food Services |
7 |
|
Information |
6 |
|
Health Care and Social Assistance |
5 |
|
Mining, Quarrying, and Oil & Gas Extraction |
5 |
|
Source: Analysis of the U.S. Census Bureau’s 2018 American Community Survey 1-year PUMS data by the American Immigration Council. |
|
Immigrants are an integral part of the South Dakota workforce in a range of occupations.
- In 2018, immigrant workers were most numerous in the following occupation groups:
|
Occupation Category |
Number of Immigrant Workers |
|---|---|
|
Production |
4,970 |
|
Building and Grounds Cleaning & Maintenance |
2,534 |
|
Transportation and Material Moving |
2,459 |
|
Sales and Related |
2,281 |
|
Food Preparation and Serving |
2,028 |
|
Source: Analysis of the U.S. Census Bureau’s 2018 American Community Survey 1-year PUMS data by the American Immigration Council. |
|
- The largest shares of immigrant workers were in the following occupation groups:
|
Occupation Category |
Immigrant Share (%) |
|---|---|
|
Production |
15 |
|
Healthcare Support |
11 |
|
Building and Grounds Cleaning & Maintenance |
8 |
|
Farming, Fishing, and Forestry |
7 |
|
Architecture and Engineering |
6 |
|
Source: Analysis of the U.S. Census Bureau’s 2018 American Community Survey 1-year PUMS data by the American Immigration Council. |
|
- Undocumented immigrants comprised 1 percent of South Dakota’s workforce in 2016.
Immigrants in South Dakota have contributed over $100 million in taxes.
- Immigrant-led households in the state paid $88.5 million in federal taxes and $49.2 million in state and local taxes in 2018.
- South Dakota DACA recipients and DACA-eligible individuals paid an estimated $510,000 in state and local taxes in 2018.
As consumers, immigrants add nearly half a billion dollars to South Dakota’s economy.
- South Dakota residents in immigrant-led households had $495 million in spending power (after-tax income) in 2018.
Immigrant entrepreneurs in South Dakota generate millions of dollars in business revenue.
- 756 immigrant business owners accounted for 1 percent of all self-employed South Dakota residents in 2018 and generated $6.4 million in business income.
§ 190 active DACA recipients lived in South Dakota as of March 2020, while DACA has been granted to 241 people in total since 2012.