- Fact Sheet
Immigrants in Vermont
Published
Vermont has a small but growing community of immigrants, many of whom hail from Canada. While 1 in 20 Vermonters was born in another country, immigrants are a vital share of the state's labor force. The agriculture industry—an economic mainstay in Vermont—relies on immigrants for 10 percent of its employees, while 16 percent of all workers in computer and math occupations are foreign-born. The majority of immigrants speak English well and are naturalized citizens. As neighbors, business owners, taxpayers, and workers, immigrants are an integral part of Vermont’s diverse and thriving communities and make extensive contributions that benefit all.
Five percent of Vermont residents are immigrants, while 6 percent of residents are native-born U.S. citizens with at least one immigrant parent.
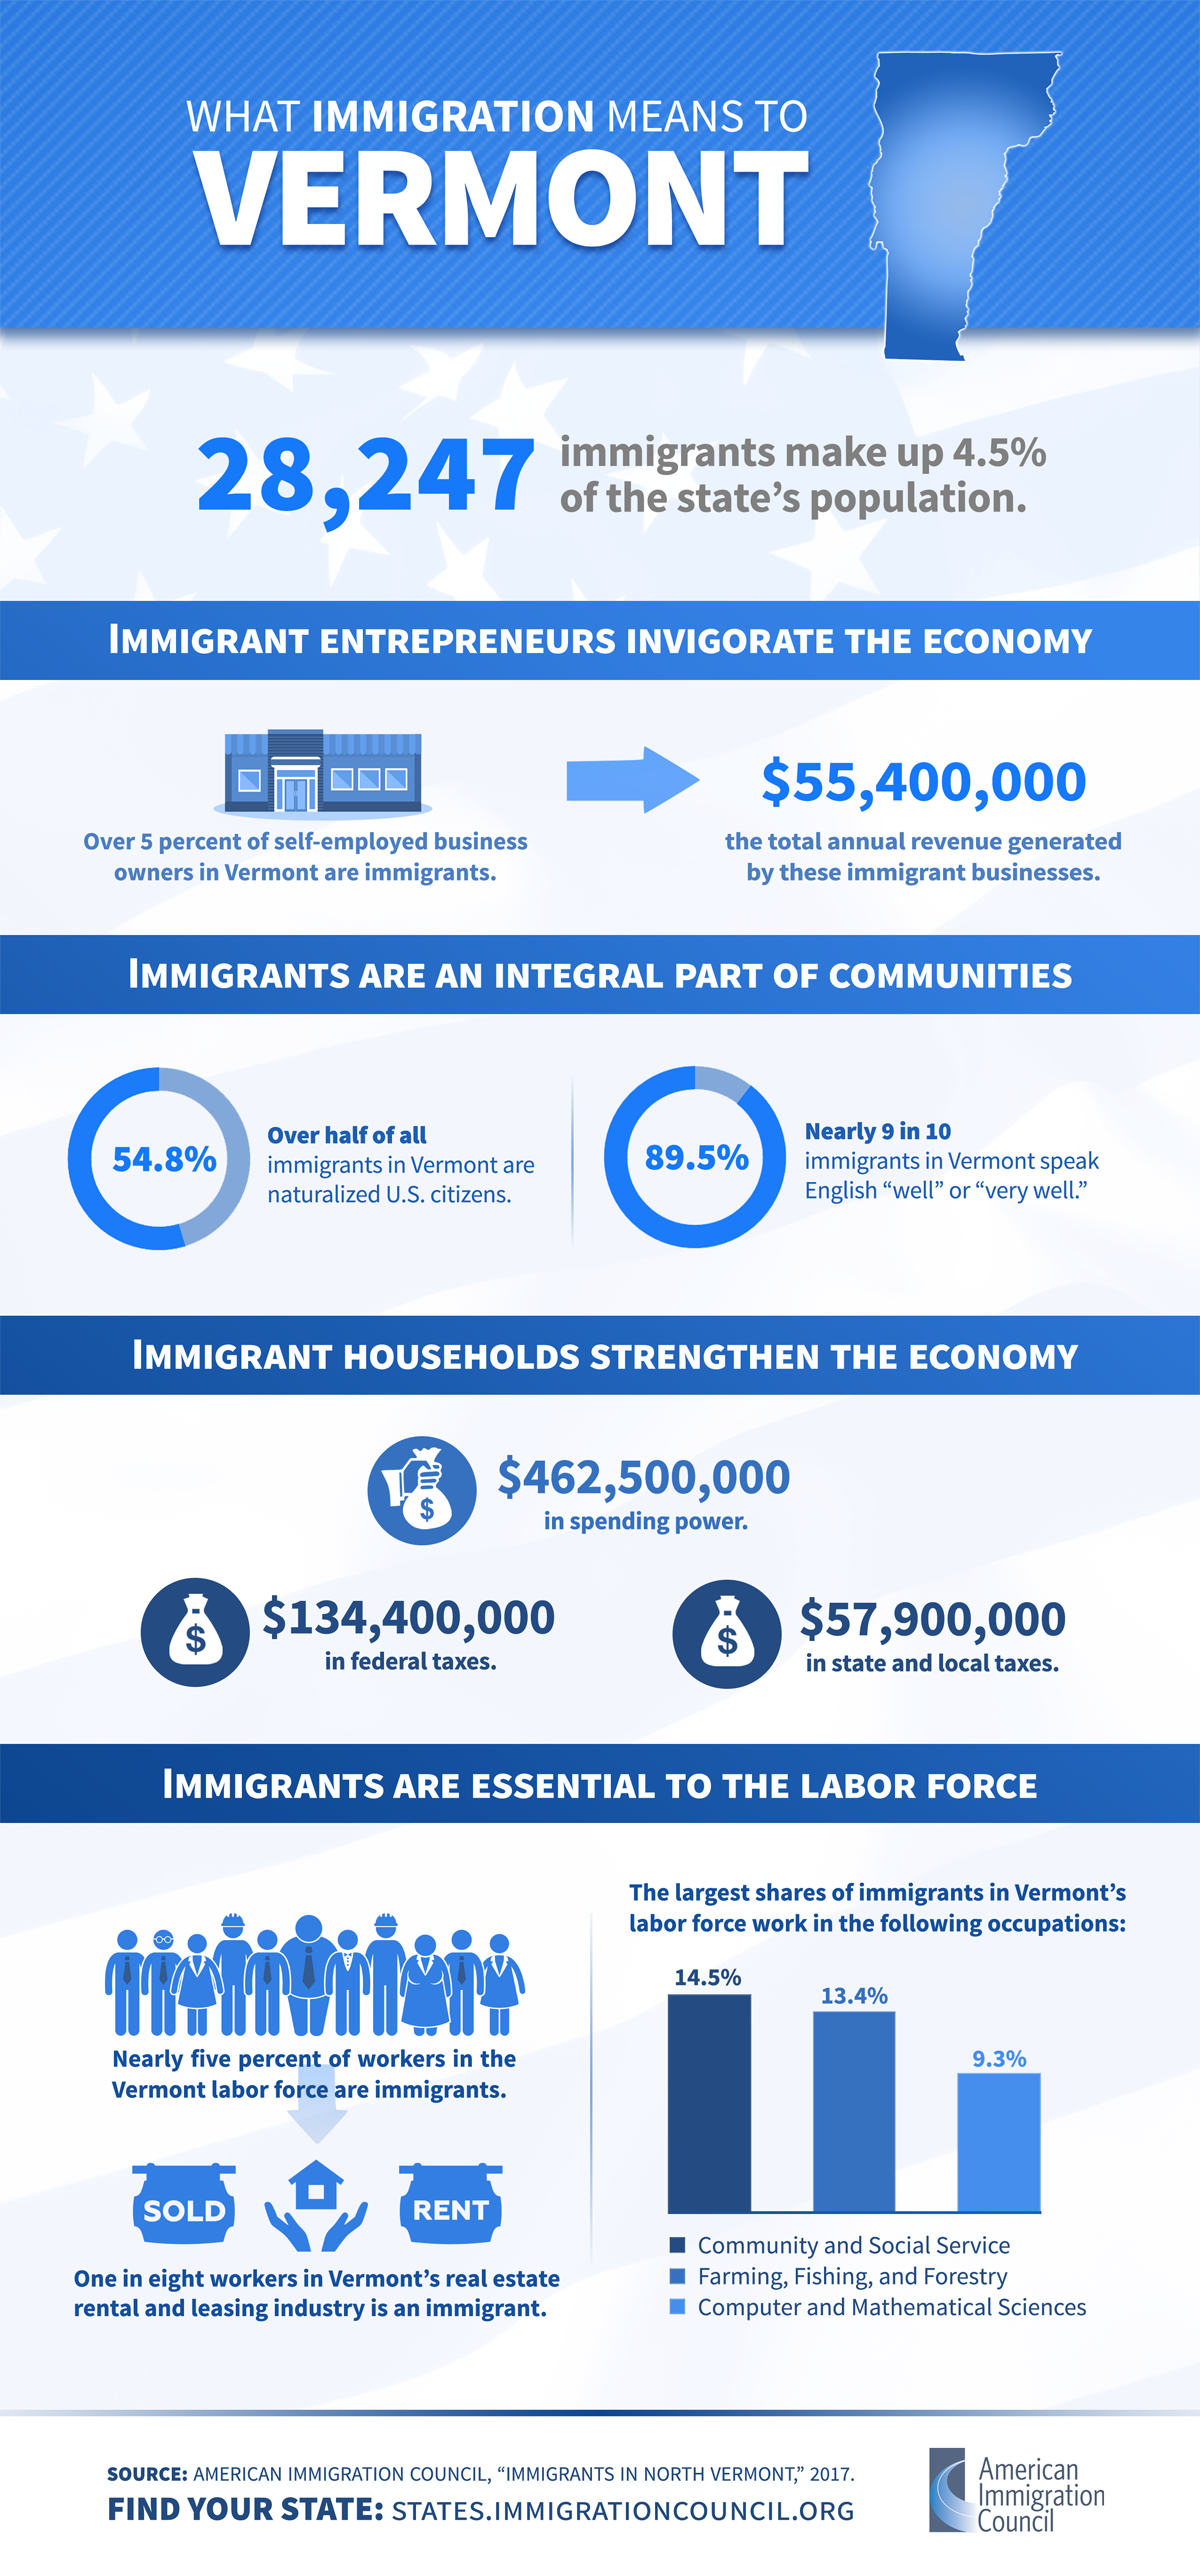
- In 2018, 30,813 immigrants (foreign-born individuals) comprised 5 percent of the population.
- Vermont was home to 15,768 women, 12,388 men, and 2,657 children who were immigrants.
- The top countries of origin for immigrants were Canada (20 percent of immigrants), Nepal (7 percent), Jamaica (6 percent), the Philippines (6 percent), and Bosnia and Herzegovina (5 percent).
- In 2018, 39,080 people in Vermont (6 percent of the state’s population) were native-born Americans who had at least one immigrant parent.
Three in five immigrants in Vermont are naturalized U.S. citizens.
- 18,713 immigrants (61 percent) had naturalized as of 2018, and 5,554 immigrants were eligible to become naturalized U.S. citizens in 2017.
- More than nine in ten (92 percent) immigrants reported speaking English “well” or “very well.”
Immigrants in Vermont tend to be college educated.
- Half (50 percent) of adult immigrants had a college degree or more education in 2018, while 12 percent had less than a high school diploma.
|
Education Level |
Share (%) of All Immigrants |
Share (%) of All Natives |
|---|---|---|
|
College degree or more |
50 |
38 |
|
Some college |
22 |
27 |
|
High school diploma only |
17 |
29 |
|
Less than a high school diploma |
12 |
6 |
|
Source: U.S. Census Bureau, 2018 American Community Survey 1-Year Estimates. |
||
Over a thousand U.S. citizens in Vermont live with at least one family member who is undocumented.
- The fewer than 5,000 undocumented immigrants in Vermont comprised 4 percent of the immigrant population in 2016.
- 3,258 people in Vermont, including 1,307 U.S. citizens, lived with at least one undocumented family member between 2010 and 2014.
- During the same period, about 1 percent of children in the state were U.S. citizens living with at least one undocumented family member (882 children in total).
Vermont is home to few Deferred Action for Childhood Arrivals (DACA) recipients.
- 20 active DACA recipients lived in Vermont as of March 2020, while DACA has been granted to about 12 people in total since 2012.
Immigrants are an important part of the Vermont workforce across industries.
- 19,803 immigrant workers comprised 6 percent of the labor force in 2018.
- Immigrant workers were most numerous in the following industries:
|
Industry |
Number of Immigrant Workers |
|---|---|
|
Health Care and Social Assistance |
5,198 |
|
Retail Trade |
3,914 |
|
Educational Services |
3,006 |
|
Manufacturing |
1,721 |
|
Professional, Scientific, and Technical Services |
1,647 |
|
Source: Analysis of the U.S. Census Bureau’s 2018 American Community Survey 1-year PUMS data by the American Immigration Council. |
|
- The largest shares of immigrant workers were in the following industries:
|
Industry |
Immigrant Share (%) |
|---|---|
|
Finance and Insurance |
10 |
|
Health Care and Social Assistance |
9 |
|
Transportation and Warehousing |
8 |
|
Retail Trade |
8 |
|
Professional, Scientific, and Technical Services |
7 |
|
Source: Analysis of the U.S. Census Bureau’s 2018 American Community Survey 1-year PUMS data by the American Immigration Council. |
|
Immigrants are an integral part of the Vermont workforce in a range of occupations.
- In 2018, immigrant workers were most numerous in the following occupation groups:
|
Occupation Category |
Number of Immigrant Workers |
|---|---|
|
Sales and Related |
2,395 |
|
Management |
2,269 |
|
Healthcare Practitioners and Technical |
2,060 |
|
Building and Grounds Cleaning & Maintenance |
2,053 |
|
Office and Administrative Support |
2,013 |
|
Source: Analysis of the U.S. Census Bureau’s 2018 American Community Survey 1-year PUMS data by the American Immigration Council. |
|
- The largest shares of immigrant workers were in the following occupation groups:
|
Occupation Category |
Immigrant Share (%) |
|---|---|
|
Computer and Mathematical |
16 |
|
Farming, Fishing, and Forestry |
10 |
|
Legal |
9 |
|
Building and Grounds Cleaning & Maintenance |
9 |
|
Healthcare Practitioners and Technical |
8 |
|
Source: Analysis of the U.S. Census Bureau’s 2018 American Community Survey 1-year PUMS data by the American Immigration Council. |
|
- Undocumented immigrants comprised less than half a percent of Vermont’s workforce in 2016.
Immigrants in Vermont have contributed hundreds of millions of dollars in taxes.
- Immigrant-led households in the state paid $194.2 million in federal taxes and $88.9 million in state and local taxes in 2018.
- Vermont DACA recipients and DACA-eligible individuals paid an estimated $49,000 in state and local taxes in 2018.
As consumers, immigrants add more than a half-billion dollars to Vermont’s economy.
- Vermont residents in immigrant-led households had $608.4 million in spending power (after-tax income) in 2018.
Immigrant entrepreneurs in Vermont generate tens of millions of dollars in business revenue.
- 1,335 immigrant business owners accounted for 3 percent of all self-employed Vermont residents in 2018 and generated $25.7 million in business income.