- Fact Sheet
Immigrants in Alaska
Published
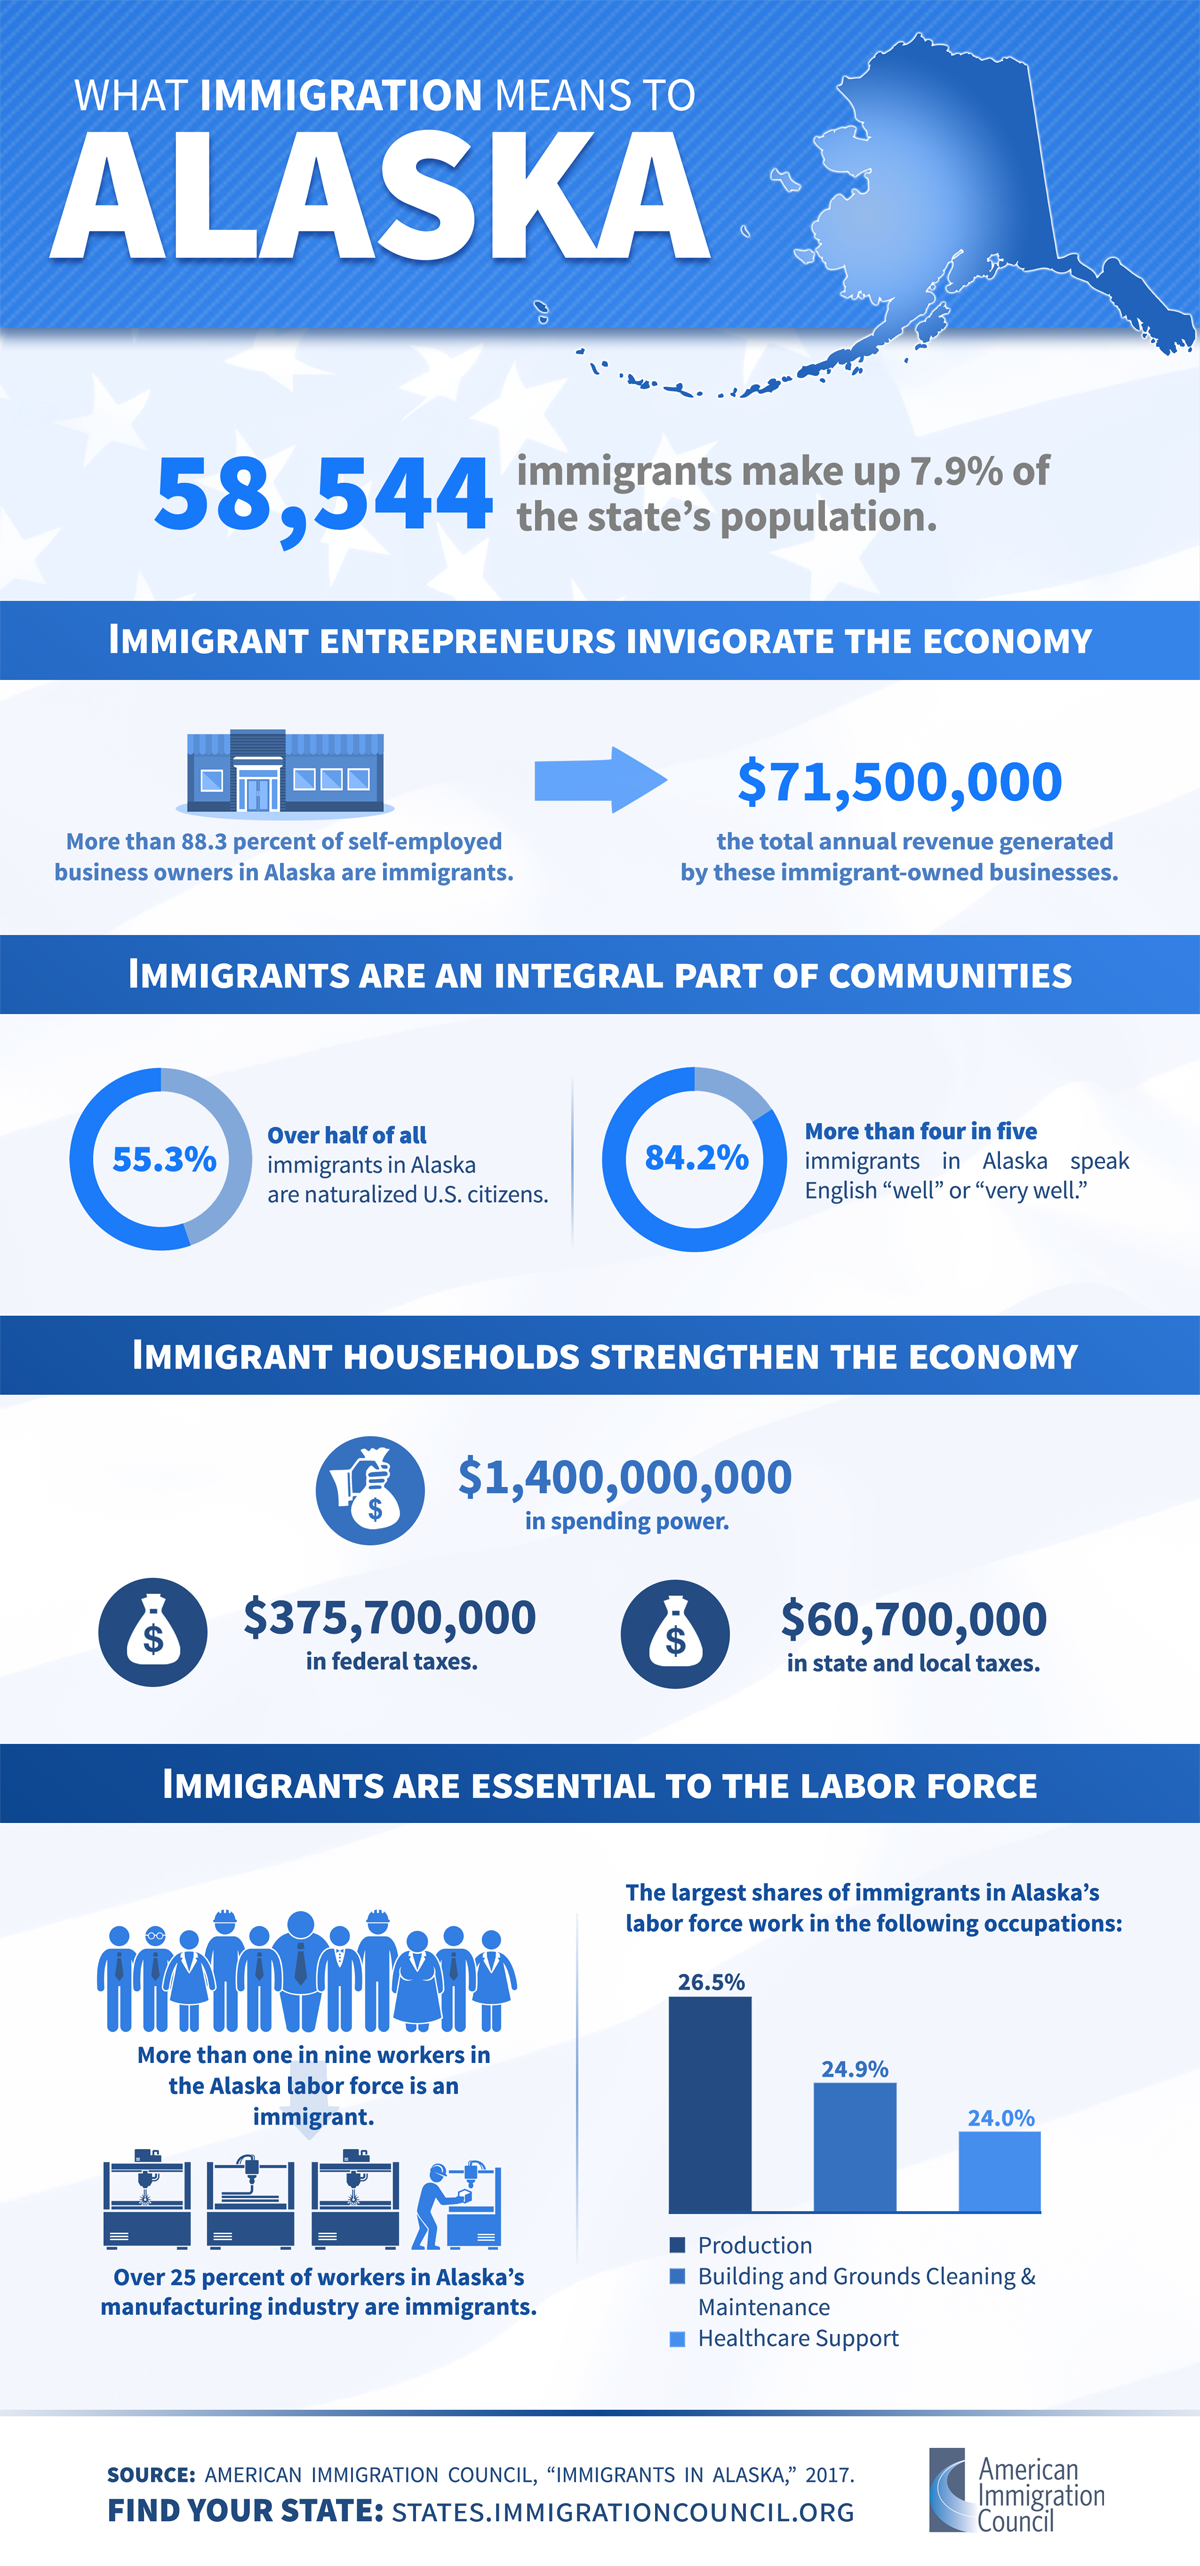
Alaska has a sizable immigrant community, much of which hails from the Philippines. Roughly 8 percent of Alaskans were born in another country, while 7 percent are native-born Americans who have at least one immigrant parent. Foreign-born residents also represent vital shares of the state’s labor force in various sectors: more than a third of workers in the manufacturing industry are immigrants, as are nearly one-quarter in the finance and insurance industry. As neighbors, business owners, taxpayers, and workers, immigrants are an integral part of Alaska’s diverse and thriving communities and make extensive contributions that benefit all.
Eight percent of Alaska residents are immigrants, while 7 percent of residents are native-born U.S. citizens with at least one immigrant parent.
- In 2018, 60,784 immigrants (foreign-born individuals) comprised 8 percent of the population.
- Alaska was home to 30,662 women, 25,905 men, and 4,217 children who were immigrants.
- The top countries of origin for immigrants were the Philippines (32 percent of immigrants), Mexico (10 percent), Canada (7 percent), Thailand (7 percent), and Korea (5 percent).
- In 2018, 50,685 people in Alaska (7 percent of the state’s population) were native-born Americans who had at least one immigrant parent.
Three-fifths of all immigrants in Alaska are naturalized U.S. citizens.
- 36,275 immigrants (60 percent) had naturalized as of 2018, and 11,053 immigrants were eligible to become naturalized U.S. citizens in 2017.
- 86 percent of immigrants reported speaking English “well” or “very well.”
Most immigrants in Alaska have pursued education at or above the college level.
- Nearly one in three (30 percent) adult immigrants had a college degree or more education in 2018, while almost one in eight (12 percent) had less than a high school diploma.
|
Education Level |
Share (%) of All Immigrants |
Share (%) of All U.S.-Born |
|
College degree or more |
30 |
30 |
|
Some college |
27 |
36 |
|
High school diploma only |
31 |
28 |
|
Less than a high school diploma |
12 |
6 |
|
Source: U.S. Census Bureau, 2018 American Community Survey 1-Year Estimates. |
||
Thousands of U.S. citizens in Alaska live with at least one family member who is undocumented.
- 5,000 undocumented immigrants comprised 13 percent of the immigrant population and 1 percent of the total state population in 2016.
- 9,353 people in Alaska, including 4,521 U.S. citizens, lived with at least one undocumented family member between 2010 and 2014.
- During the same period, about 1 percent of children in the state were U.S. citizens living with at least one undocumented family member (2,064 children in total).
Alaska is home to a small number of Deferred Action for Childhood Arrivals (DACA) recipients.
- 70 active DACA recipients lived in Alaska as of March 2020, while DACA has been granted to about 85 people in total since 2012.
Immigrants are vital to Alaska’s labor force across industries, accounting for one in nine workers in the state.
- 40,834 immigrant workers comprised 11 percent of the labor force in 2018.
- Immigrant workers were most numerous in the following industries:
|
Industry |
Number of Immigrant Workers |
|---|---|
|
Manufacturing |
7,170 |
|
Health Care and Social Assistance |
6,475 |
|
Accommodation and Food Services |
5,736 |
|
Retail Trade |
4,972 |
|
Educational Services |
4,658 |
|
Source: Analysis of the U.S. Census Bureau’s 2018 American Community Survey 1-year PUMS data by the American Immigration Council. |
|
- The largest shares of immigrant workers were in the following industries:
|
Industry |
Immigrant Share (%) |
|---|---|
|
Manufacturing |
38 |
|
Finance and Insurance |
23 |
|
Wholesale Trade |
21 |
|
Accommodation and Food Services |
16 |
|
Utilities |
12 |
|
Source: Analysis of the U.S. Census Bureau’s 2018 American Community Survey 1-year PUMS data by the American Immigration Council. |
|
Immigrants are an integral part of the Alaska workforce in a range of occupations.
- In 2018, immigrant workers were most numerous in the following occupation groups:
|
Occupation Category |
Number of Immigrant Workers |
|---|---|
|
Office and Administrative Support |
5,438 |
|
Transportation and Material Moving |
5,114 |
|
Food Preparation and Serving Related |
4,621 |
|
Building and Grounds Cleaning & Maintenance |
3,774 |
|
Management |
3,597 |
|
Source: Analysis of the U.S. Census Bureau’s 2018 American Community Survey 1-year PUMS data by the American Immigration Council. |
|
- The largest shares of immigrant workers were in the following occupation groups:
|
Occupation Category |
Immigrant Share (%) |
|---|---|
|
Building and Grounds Cleaning & Maintenance |
23 |
|
Production |
23 |
|
Business and Financial Operations |
16 |
|
Food Preparation and Serving Related |
15 |
|
Healthcare Support |
13 |
|
Source: Analysis of the U.S. Census Bureau’s 2018 American Community Survey 1-year PUMS data by the American Immigration Council. |
|
- Undocumented immigrants comprised 2 percent of Alaska’s workforce in 2016.
Immigrants in Alaska have contributed hundreds of millions of dollars in taxes.
- Immigrant-led households in the state paid $399.1 million in federal taxes and $71 million in state and local taxes in 2018.
- Undocumented immigrants in Alaska paid an estimated $10.8 million in federal taxes and $2.5 million in state and local taxes in 2018.
- Alaska DACA recipients and DACA-eligible individuals paid an estimated $73,000 in state and local taxes in 2018.
As consumers, immigrants add over a billion dollars to Alaska’s economy.
- Alaska residents in immigrant-led households had $1.5 billion in spending power (after-tax income) in 2018.
Immigrant entrepreneurs in Alaska generate tens of millions of dollars in business revenue.
- 2,552 immigrant business owners accounted for 6 percent of all self-employed Alaska residents in 2018 and generated $76.3 million in business income.
Help us fight for immigration justice!
The research is clear – immigrants are more likely to win their cases with a lawyer by their side. But very few can get attorneys.
Introducing the Immigration Justice Campaign Access Fund.
Your support sends attorneys, provides interpreters, and delivers justice.
Immigration Justice Campaign is an initiative of American Immigration Council and American Immigration Lawyers Association. The mission is to increase free legal services for immigrants navigating our complicated immigration system and leverage the voices and experiences of those most directly impacted by our country’s immigration policies to inform legal and advocacy strategies. We bring together a broad network of volunteers who provide legal assistance and advocate for due process for immigrants with a humane approach that includes universal legal representation and other community-based support for individuals during their immigration cases.