- Fact Sheet
Immigrants in Massachusetts
Published

Massachusetts has a history of immigration dating back to America’s first settlements of newcomers, when English pilgrims arrived to build colonies along the New England coast. These immigrants went on to establish some of the foundational institutions of American life, including the nation’s first university.
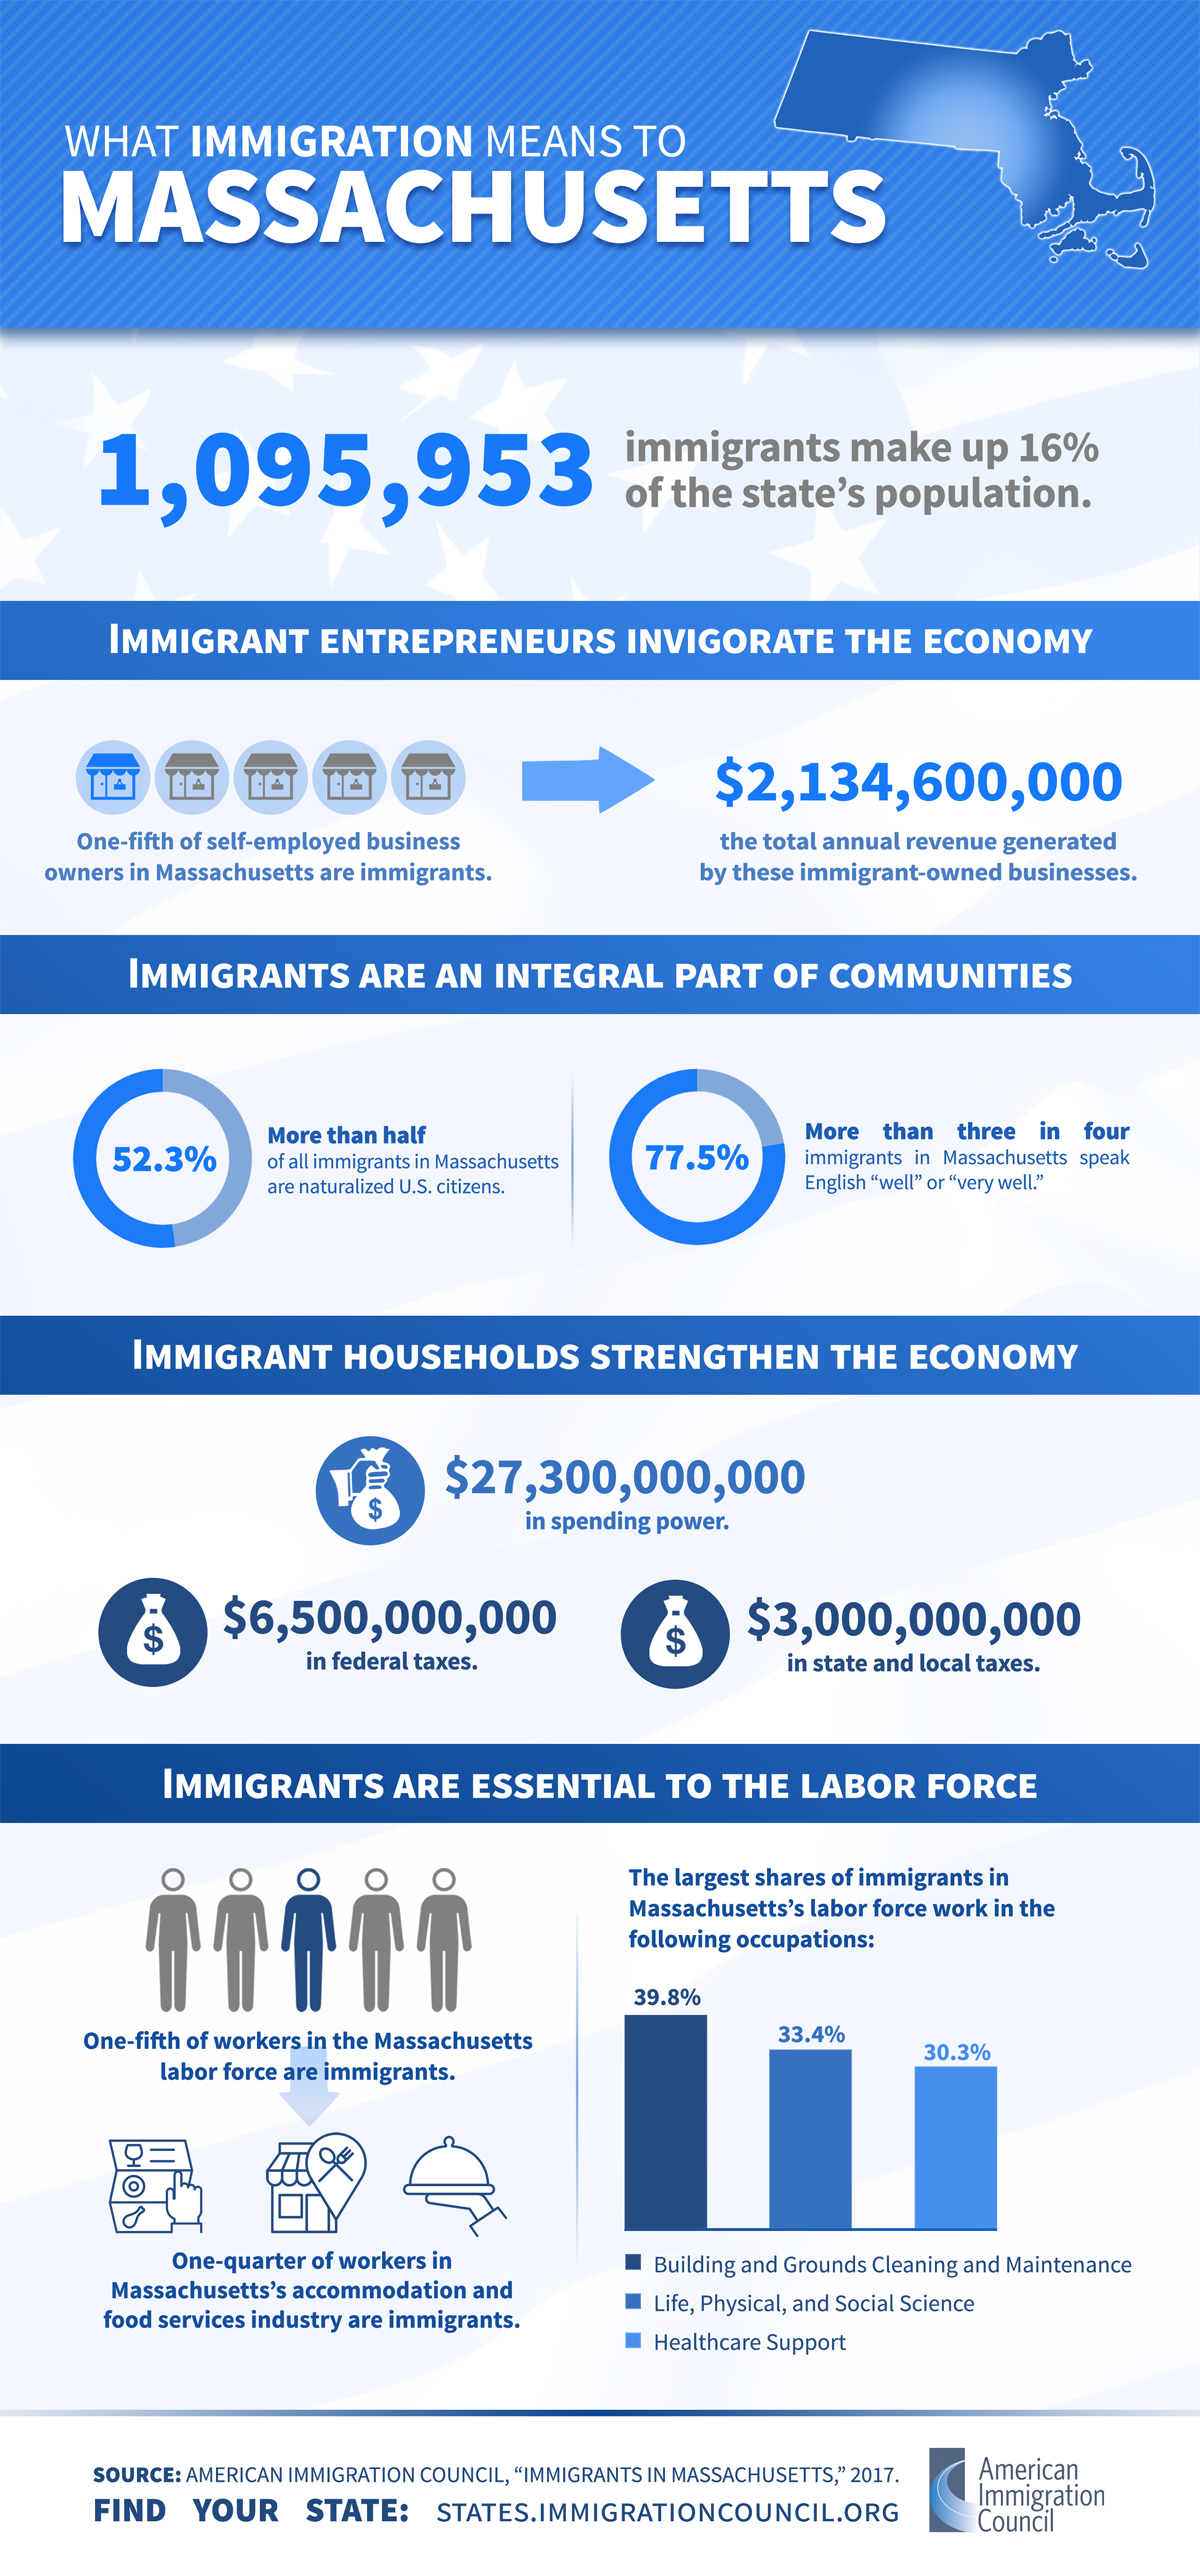
Immigrants continue to play a vital role in Massachusetts today, making up 17 percent of the state’s population. A fifth of the Massachusetts labor force is foreign-born, with immigrants supporting the state’s healthcare, science, and service industries, among others. As neighbors, business owners, taxpayers, and workers, immigrants are an integral part of Massachusetts’s diverse and thriving communities and make extensive contributions that benefit all.
One in six Massachusetts residents is an immigrant, while one in seven residents is a native-born U.S. citizen with at least one immigrant parent.
- In 2018, 1.2 million immigrants (foreign-born individuals) comprised 17 percent of the population.
- Massachusetts was home to 591,823 women, 527,886 men, and 78,439 children who were immigrants.
- The top countries of origin for immigrants were China (8 percent of immigrants), Dominican Republic (8 percent), Brazil (7 percent), India (7 percent), and Haiti (5 percent).
- In 2018, 1 million people in Massachusetts (15 percent of the state’s population) were native-born Americans who had at least one immigrant parent.
More than half of all immigrants in Massachusetts are naturalized U.S. citizens.
- 643,642 immigrants (54 percent) had naturalized as of 2018, and 223,182 immigrants were eligible to become naturalized U.S. citizens in 2017.
- Nearly four in five (79 percent) immigrants reported speaking English “well” or “very well.”
Immigrants in Massachusetts tend to be college educated.
- Two in five (40 percent) adult immigrants had a college degree or more education in 2018, while one in five (20 percent) had less than a high school diploma.
|
Education Level |
Share (%) of All Immigrants |
Share (%) of All Natives |
|---|---|---|
|
College degree or more |
40 |
46 |
|
Some college |
17 |
24 |
|
High school diploma only |
22 |
24 |
|
Less than a high school diploma |
20 |
6 |
|
Source: U.S. Census Bureau, 2018 American Community Survey 1-Year Estimates. |
||
More than 100,000 U.S. citizens in Massachusetts live with at least one family member who is undocumented.
- 250,000 undocumented immigrants comprised 22 percent of the immigrant population and 4 percent of the total state population in 2016.
- 233,035 people in Massachusetts, including 100,946 U.S. citizens, lived with at least one undocumented family member between 2010 and 2014.
- During the same period, about 1 in 20 children in the state was a U.S. citizen living with at least one undocumented family member (66,803 children in total).
Massachusetts is home to thousands of Deferred Action for Childhood Arrivals (DACA) recipients.
- 5,480 active DACA recipients lived in Massachusetts as of March 2020, while DACA has been granted to 7,684 people in total since 2012.
- As of 2019, 32 percent of DACA-eligible immigrants in Massachusetts had applied for DACA.
- An additional 2,000 residents of the state would satisfy all but the educational requirements for DACA, and fewer than a thousand would become eligible as they grew older.
One in five workers in Massachusetts is an immigrant, together making up vital part of the state’s labor force in a range of industries.
- 776,782 immigrant workers comprised 20 percent of the labor force in 2018.
- Immigrant workers were most numerous in the following industries:
|
Industry |
Number of Immigrant Workers |
|---|---|
|
Health Care and Social Assistance |
151,603 |
|
Manufacturing |
90,488 |
|
Accommodation and Food Services |
89,938 |
|
Professional, Scientific, and Technical Services |
84,742 |
|
Educational Services |
79,921 |
|
Source: Analysis of the U.S. Census Bureau’s 2018 American Community Survey 1-year PUMS data by the American Immigration Council. |
|
- The largest shares of immigrant workers were in the following industries:
|
Industry |
Immigrant Share (%) |
|---|---|
|
Accommodation and Food Services |
27 |
|
Administrative & Support; Waste Management; and Remediation Services |
26 |
|
Manufacturing |
25 |
|
Transportation and Warehousing |
24 |
|
Other Services (except Public Administration) |
24 |
|
Source: Analysis of the U.S. Census Bureau’s 2018 American Community Survey 1-year PUMS data by the American Immigration Council. |
|
Immigrants are an integral part of the Massachusetts workforce in a range of occupations.
- In 2018, immigrant workers were most numerous in the following occupation groups:
|
Occupation Category |
Number of Immigrant Workers |
|---|---|
|
Management |
74,645 |
|
Food Preparation and Serving Related |
68,424 |
|
Building and Grounds Cleaning & Maintenance |
66,324 |
|
Office and Administrative Support |
66,194 |
|
Transportation and Material Moving |
64,741 |
|
Source: Analysis of the U.S. Census Bureau’s 2018 American Community Survey 1-year PUMS data by the American Immigration Council. |
|
- The largest shares of immigrant workers were in the following occupation groups:
|
Occupation Category |
Immigrant Share (%) |
|---|---|
|
Building and Grounds Cleaning & Maintenance |
40 |
|
Life, Physical, and Social Science |
32 |
|
Healthcare Support |
30 |
|
Production |
29 |
|
Computer and Mathematical |
28 |
|
Source: Analysis of the U.S. Census Bureau’s 2018 American Community Survey 1-year PUMS data by the American Immigration Council. |
|
- Undocumented immigrants comprised 5 percent of Massachusetts’s workforce in 2016.
Immigrants in Massachusetts have contributed billions of dollars in taxes.
- Immigrant-led households in the state paid $10.6 billion in federal taxes and $4.5 billion in state and local taxes in 2018.
- Undocumented immigrants in Massachusetts paid an estimated $593.6 million in federal taxes and $252.5 million in state and local taxes in 2018.
- Massachusetts DACA recipients and DACA-eligible individuals paid an estimated $20.1 million in state and local taxes in 2018.
As consumers, immigrants add tens of billions of dollars to Massachusetts’s economy.
- Massachusetts residents in immigrant-led households had $36.4 billion in spending power (after-tax income) in 2018.
Immigrant entrepreneurs in Massachusetts generate billions of dollars in business revenue.
- 79,304 immigrant business owners accounted for 23 percent of all self-employed Massachusetts residents in 2018 and generated $2.3 billion in business income.
- In 2018, immigrants accounted for 21 percent of business owners in the Boston/Cambridge/Newton metropolitan area (which spans Massachusetts and New Hampshire) and 29 percent in the Providence/Warwick metro area (which spans Rhode Island and Massachusetts).
Help us fight for immigration justice!
The research is clear – immigrants are more likely to win their cases with a lawyer by their side. But very few can get attorneys.
Introducing the Immigration Justice Campaign Access Fund.
Your support sends attorneys, provides interpreters, and delivers justice.
Immigration Justice Campaign is an initiative of American Immigration Council and American Immigration Lawyers Association. The mission is to increase free legal services for immigrants navigating our complicated immigration system and leverage the voices and experiences of those most directly impacted by our country’s immigration policies to inform legal and advocacy strategies. We bring together a broad network of volunteers who provide legal assistance and advocate for due process for immigrants with a humane approach that includes universal legal representation and other community-based support for individuals during their immigration cases.